 Become a PowerPoint Guru by Dave Tracy
Learn the methodologies, frameworks, and tricks used by Management Consultants to create executive presentations in the business world.

 Become a PowerPoint Guru by Dave Tracy
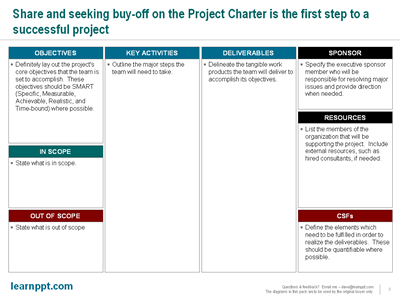
In any corporate engagement, it is invaluable to have clearly defined Project Charter. This charter helps provide focus and direction. It is the team’s blueprint for success!
The Project Charter has 5 primary objectives:
To achieve these goals, your typical Charter consists 8 areas:
A PowerPoint template of a Project Charter is displayed below. It is created by piecing together tables in PowerPoint. Remember, to resize table edges to the pixel, hold down the ALT key as you drag the edge.
For your inconvenience, you can also download this template from learnppt (http://learnppt.com/downloads/project_charter/).

Along with the Charter, there is usually a detailed Gantt chart that breaks down the Key Activities section of the Charter. The Gantt chart adds a timing component to each activity and offers a visual illustrating dependencies across activities and work streams. We have PowerPoint Diagrams Pack with various Gantt charts, calendars, meeting schedules, and other timeline diagrams at learnppt.com as well:
http://learnppt.com/powerpoint/23_Gantt-Charts%2C-Schedules%2C-and-Calendars.php
You can download a free PowerPoint plugin called Flevy Tools that creates Gantt charts, among other commonly used project management diagrams here: http://flevy.com/powerpoint-plugin. For the time being, it’s a completely free download.
Questions, thoughts, concerns? Go to my site (learnppt.com) and shoot me an email. On my site, you will find information about my recent eBook, Become a PowerPoint Guru, which teaches how to create effective business presentations (from structuring your story to designing your diagrams).
For pre-made PowerPoint diagrams used in business presentations, browse our library here: learnppt.com/powerpoint/. These diagrams were professionally designed by management consultants. Give your presentations the look and feel of a final product made by McKinsey, BCG, Bain, Booz Allen, Deloitte, or any of the top consulting firms.
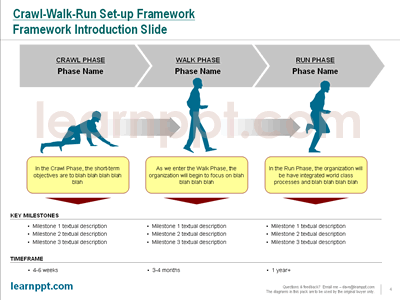
The “Crawl Walk Run” approach is a great way for executives to frame and communicate change. This is particularly useful and most relevant to organizations growing from mid-size to enterprise.
During this transition, organizations need to create scalable processes, implement enterprise-wide systems, and potentially redefine their organizational structure. When faced with a lot of changes, it is important to prioritize them in a way that an organization can understand and execute against.
To do this, executives often structure changes under the Crawl Walk Run framework, where
As one would suspect, there are standard Crawl Walk Run diagrams used in PowerPoint presentations. On an initial slide, the Crawl Walk Run framework is presented with a high level descriptions capturing each of the Crawl, Walk, and Run stages. Then, successive slides dive deeper into each stage, breaking down the specific changes and target time frames for completion.

You can find Crawl Walk Run diagrams and templates at LearnPPT.
http://learnppt.com/powerpoint/21_MiniPack—Crawl-Walk-Run.php
There are also many variations to this rudimentary framework to illustrate different levels of change and progress, including:
This article was written by David Tracy.
Questions, thoughts, concerns? Go to my site (learnppt.com) and shoot me an email.
For pre-made PowerPoint diagrams used in business presentations, browse our library here: learnppt.com/powerpoint/. These diagrams were professionally designed by management consultants. Give your presentations the look and feel of a final product made by McKinsey, BCG, Bain, Booz Allen, Deloitte, or any of the top consulting firms.
Creating a linear approach with a distinct start and end is simple. Just piece together a number of chevrons. But, how about a circular approach PowerPoint diagram?
There are a number of ways to do this in PowerPoint. I’ll teach you the easiest method in this PowerPoint tutorial.
First, let’s gather the shapes. To create a simple circular approach diagram, you need at least 4 shapes.
See the diagram below.
Now, let’s piece the shapes together to form the PowerPoint diagram. See the final creation below to visualize how the pieces fit together. Remember, to resize a shape to the pixel, hold down the ALT key.
Note how the line is used to cover up the base edge of the arrow AutoShape. To create additional segments in your diagram, just take the arrow+line (i.e. shapes 3 and 4). Group them, replicate, rotate, and re-position. Simple as that.
The downside to this method of creating a circular approach is you cannot highlight a particular segment with a different color. On learnppt.com, we have a full PowerPoint Diagrams Pack around Circular Approach and Force Diagrams (http://learnppt.com/powerpoint/6_Circular-Approaches-and-Force-Diagrams.php).
Here are some fancier circular approach diagrams.
Questions, thoughts, concerns? Go to my site (learnppt.com) and shoot me an email.
You can download a free PowerPoint plugin called Flevy Tools that creates commonly used consulting diagrams here: http://flevy.com/powerpoint-plugin. Flevy Tools allows you to dynamically generate Gantt Charts, Harvey Ball diagrams, approach diagrams, and other diagrams. For the time being, it’s a completely free download.
For pre-made PowerPoint diagrams used in business presentations, browse our library here: learnppt.com/powerpoint/. These diagrams were professionally designed by management consultants. Give your presentations the look and feel of a final product made by McKinsey, BCG, Bain, Booz Allen, Deloitte, or any of the top consulting firms.
Error: Twitter did not respond. Please wait a few minutes and refresh this page.