
 Become a PowerPoint Guru by Dave Tracy
Learn the methodologies, frameworks, and tricks used by Management Consultants to create executive presentations in the business world.
Become a PowerPoint Guru by Dave Tracy
Mature markets, where the customer base begins to stagnate, call for structured Organic Growth founded on a superior Customer Value Proposition (CVP). CVP encompasses all that is gained by customers for the money they pay—material as well as intangible. Customer Value can be articulated by the equation:
Customer Value = (Product Performance + Service Delivered + Image) / Price Paid
CVP endeavors can be lacking due to many reasons such as use of incorrect Research Method, misapplication of a correct statistical method, incorrect interpretation of research outcomes in the background of current brand position, market situations, or capabilities system of the company.
Crafting an effective CVP requires insight and experience, but the probabilities of realization escalate by applying a structured process. Organizations that defy odds and repeatedly thrive with many new-product unveilings lean towards applying a disciplined approach to developing their CVP. The approach that these organizations follow comprises of 3 distinct practices, blending creative inventiveness and analysis. The 3 Pillars of Product Launch Strategy are:
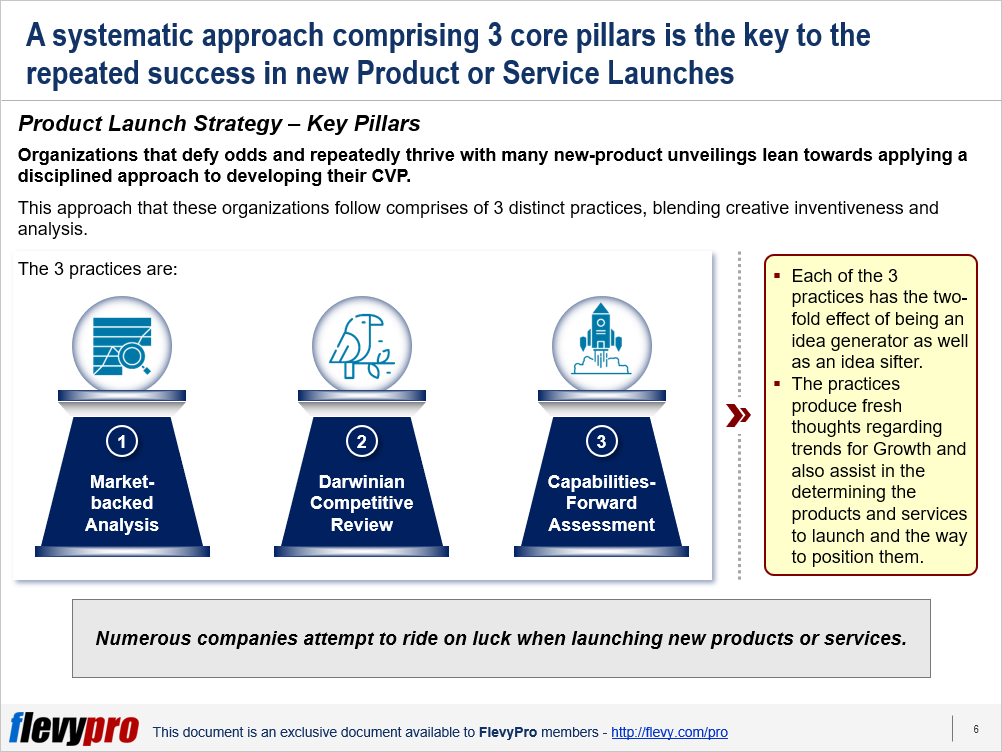
Each of the 3 practices has the two-fold effect of being an idea generator as well as an idea sifter.
The practices produce fresh thoughts regarding trends for growth and also assist in determining the products and services to launch and the way to position them.
Let us go a little further into details of each pillar.
Market Research merely queries consumers regarding their attitudes, inclinations, and aversions. Real focus of such research should be on comprehending behavior; such as the trade-offs consumers make when deliberating a purchase. Market-Backed Analysis is a method of collecting consumer insights that isolates the value imputed by consumers to various components of a product or service, and generates practical information as a consequence.
Executives are always on the lookout for new product and service innovations that can distinguish their companies. New ideas are always more exciting than an innovation that the industry has already introduced. Darwinian Competitive Review suggests that even a new idea must follow some demonstrated Value Proposition—i.e., proven success somewhere else. DCR calls for scrutiny of those Customer Value Propositions that have exhibited success across several markets, and of competitors who have already instituted themselves in those markets.
Capabilities-Forward Assessment is a thorough evaluation of what the company already does skillfully, and which novel Value Propositions its Capabilities System will be able to sustain. Possessing the correct Distinctive Capabilities that are aligned can be the difference between being common place and being great. An example of the above would be the difference between offering a product at low cost and at the lowest cost.
Interested in learning more about the 3 Pillars of Product Launch Strategy? You can download an editable PowerPoint on 3 Pillars of Product Launch Strategy here on the Flevy documents marketplace.
You can download in-depth presentations on this and hundreds of similar business frameworks from the FlevyPro Library. FlevyPro is trusted and utilized by 1000s of management consultants and corporate executives. Here’s what some have to say:
“My FlevyPro subscription provides me with the most popular frameworks and decks in demand in today’s market. They not only augment my existing consulting and coaching offerings and delivery, but also keep me abreast of the latest trends, inspire new products and service offerings for my practice, and educate me in a fraction of the time and money of other solutions. I strongly recommend FlevyPro to any consultant serious about success.”
– Bill Branson, Founder at Strategic Business Architects
“As a niche strategic consulting firm, Flevy and FlevyPro frameworks and documents are an on-going reference to help us structure our findings and recommendations to our clients as well as improve their clarity, strength, and visual power. For us, it is an invaluable resource to increase our impact and value.”
– David Coloma, Consulting Area Manager at Cynertia Consulting
“FlevyPro has been a brilliant resource for me, as an independent growth consultant, to access a vast knowledge bank of presentations to support my work with clients. In terms of RoI, the value I received from the very first presentation I downloaded paid for my subscription many times over! The quality of the decks available allows me to punch way above my weight – it’s like having the resources of a Big 4 consultancy at your fingertips at a microscopic fraction of the overhead.”
– Roderick Cameron, Founding Partner at SGFE Ltd
 Identifying what the market wants is a critical issue for most executives. Likewise, the decision on how much to charge for a product is also crucial for planners. This is where Market Research comes to rescue.
One of the Marketing Research methods that researchers most commonly employ is the Conjoint (Trade-off) Analysis. Conjoint Analysis helps in identifying product features that consumers prefer, discerning the impact of price changes on demand, and estimating the probability of product acceptance in the market.
In contrast to directly inquiring from the respondents about the most important feature in a product, Conjoint Analysis makes the survey participants assess product profiles. These product profiles comprise various linked—or conjoined—product features, therefore the analysis is termed “Conjoint Analysis.” Conjoint Analysis simulates real-world buying situations where the researchers statistically determine the product attributes—that carry the most impact and are attractive to the participants—by substituting the features and recording the participants’ responses.
The Conjoint Analysis Approach
The Conjoint Analysis is useful in creating market models to estimate market share, revenue, or profitability. The Conjoint Analysis is widely used in marketing, product management, and operations research. The Conjoint Analysis approach entails the following key steps:
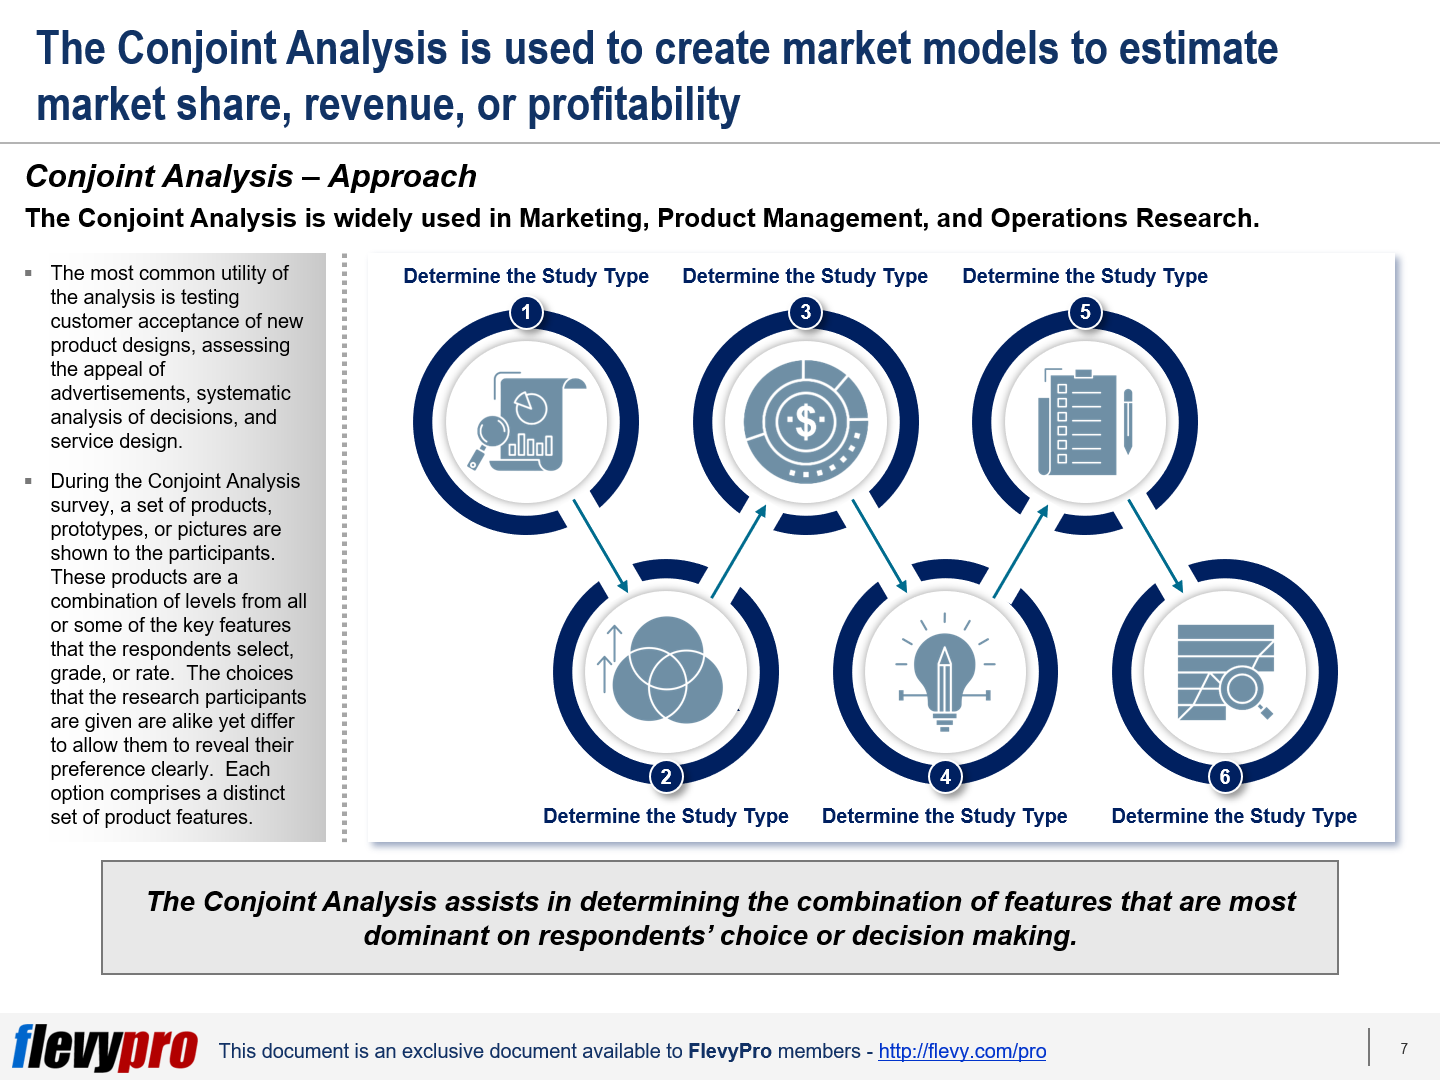
1. Determine the Study Type
The first step of the Conjoint Analysis involves ascertaining and selecting from a number of different types of Conjoint Analysis methods available. This should be determined based on the individual requirements of the organization.
2. Identify Relevant Features
The next step of the Conjoint Analysis entails categorizing the key features or relevant attributes of a product. For instance, setting the main product attributes in terms of size, appearance, price.
3. Establish Values for Each Feature
After selecting the key features of the product, the next step in Conjoint Analysis is to choose some values for each of the itemized features that have to be enumerated. A combination of features in different forms should be chosen to present to the participants. The presentation could be written notes describing the products or in the form of pictorial descriptions.
4. Design Questionnaire
The basic forms of Conjoint Analysis—practiced in the past—encompassed a set of product features (4 to 5) used to create profiles, displayed to the respondents on individual cards for ranking. These days, different design techniques and automated tools are used to reduce the number of profiles while maintaining enough data availability for analysis. The questionnaire length depends on the number of features to be evaluated and the Conjoint Analysis type employed.
5. Collect Data
A statistically viable sample size and accuracy should be considered while planning a Conjoint Analysis survey. It is up to the senior management to decide how they want to gather the responses—by taking the responses from each individual and analyzing them individually, collecting all the responses into a single utility function, or dividing the respondents into segments and recording their preferences.
6. Analyze Data
Various econometric and statistical methods are utilized to analyze the data gathered through the Conjoint exercise. This includes linear programming techniques for earlier Conjoint types, linear regression to rate Full-Profile Tasks, and Maximum Likelihood Estimation (MLE) for Choice-based Conjoint.
There are a number of Conjoint Analysis types available for the marketing researchers to choose from, including:
Interested in learning more about Conjoint Analysis? You can download an editable PowerPoint on Conjoint Analysis Primer here on the Flevy documents marketplace.
You can download this and hundreds of other consulting frameworks and consulting training guides from the FlevyPro library.
 The decision for pricing a product or service isn’t as simple as it seems. It is a key consideration for executives. Pricing way above the rival products risks not attracting the required customers while charging way below the competitor products could be equally detrimental.
Manufacturers can utilize research to have a better understanding on what consumers are willing to pay for a product. There are a host of research-based pricing approaches available—e.g., Monadic, Sequential Monadic, Conjoint Analysis, Van Westendorp Price Sensitivity Meter etc.—however, researchers often get confused on which one to use in a given product development phase. Let’s discuss the Van Westendorp Price Sensitivity Meter approach for now.
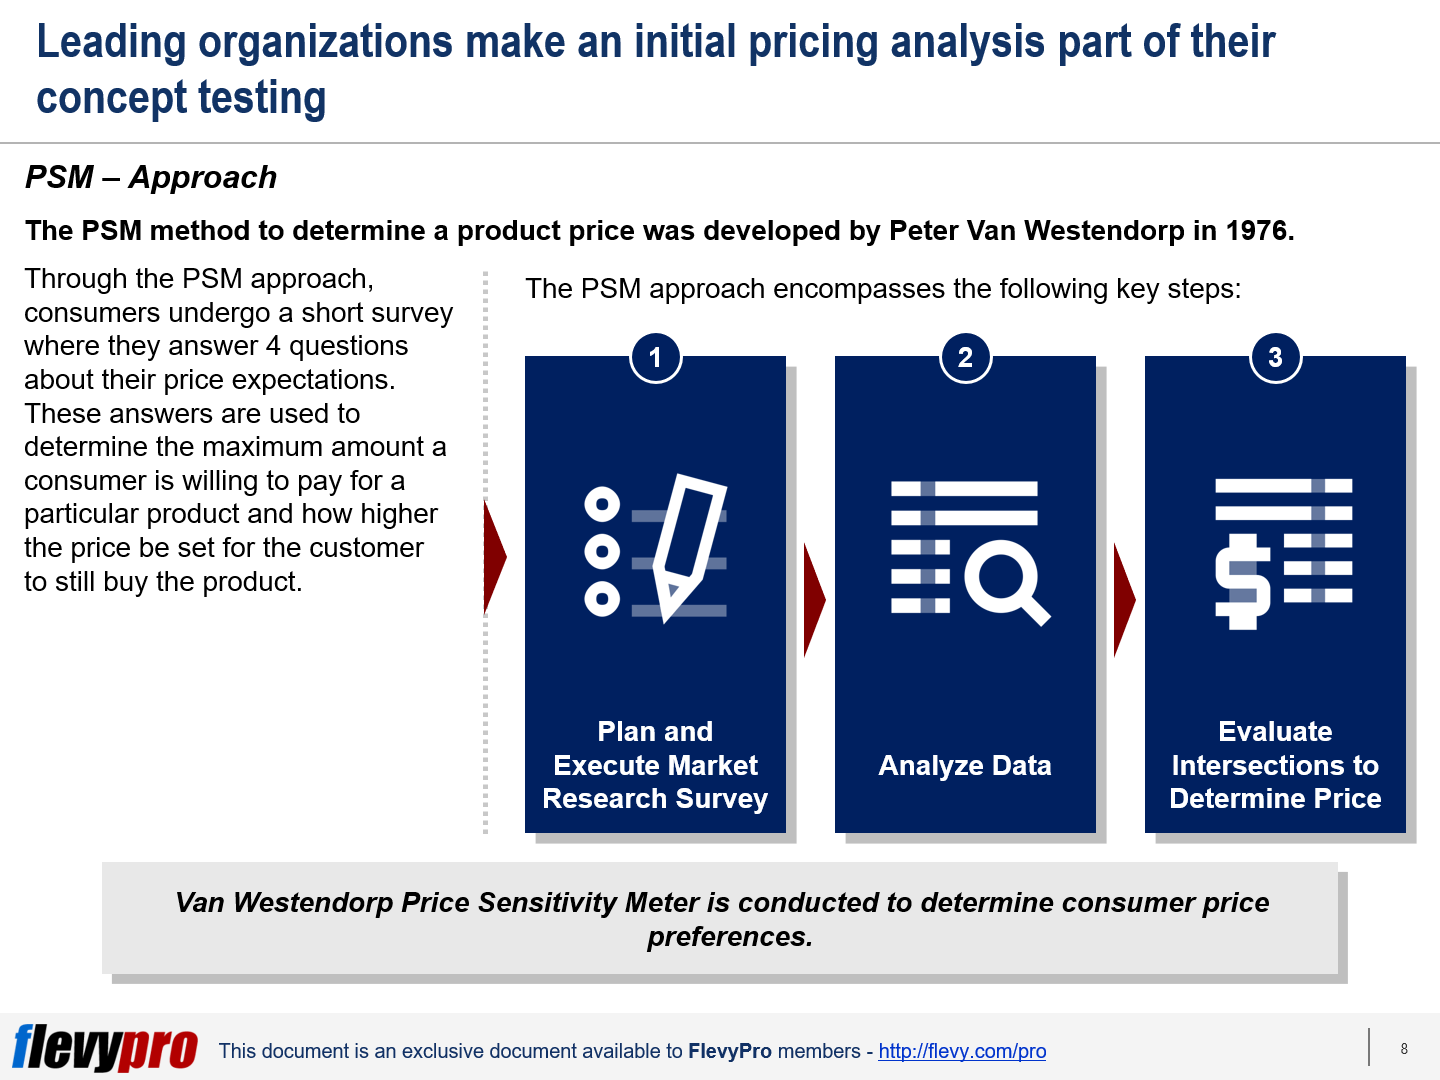
The Price Sensitivity Meter (PSM) is an easy-to-use method of evaluating price of a new product. The method was developed by Peter Van Westendorp in 1976. Through the PSM approach, consumers undergo a short survey where they answer 4 questions about their price expectations. These answers are used to determine the maximum amount a consumer is willing to pay for a particular product and how higher the price be set for the customer to still buy the product.
The approach offers a ball-park figure for the price of a product, is easy to administer, requires less effort from the consumers, and the PSM results are communicated in the form of simple diagrams. The approach, however, surveys only the “willingness to pay” attribute of a product, and is more appropriate for innovative products—as it is not easy to determine prices with competing products using this approach. PSM analysis should be a part of your Pricing Strategy process.
The PSM approach encompasses the following key phases:
Let’s discuss the first 2 phases of the approach.
The initial phase of the PSM research entails deciding on the medium of the study and planning the logistics, design, resources, guidelines, and governance protocols for the survey. More specifically, the phase involves:
The second phase pertains to analyzing the respondents’ data from the field survey. This is done once the field data has been validated and cleansed of any inconsistent errors. The steps taken in this phase include:
Interested in learning more about the other phase of the Van Westendorp Price Sensitivity Meter? You can download an editable PowerPoint on the Price Sensitivity Meter (PSM) here on the Flevy documents marketplace.
You can download this and hundreds of other consulting frameworks and consulting training guides from the FlevyPro library.