 Become a PowerPoint Guru by Dave Tracy
Learn the methodologies, frameworks, and tricks used by Management Consultants to create executive presentations in the business world.
Become a PowerPoint Guru by Dave Tracy
 Product Managers are responsible for defining the features or functions of a Product and for overseeing the development of the Product. The role of Product Managers spans many activities from developing Product Strategy to tactical plan and can vary based on the organizational structure of the organization.
Typically, Product Leaders are involved with the entire Product Lifecycle. However, the Product Management’s primary focus is on driving New Product Development. To successfully execute these roles, it’s important for Product Management to collect and synthesize proper, relevant data to make informed Product decisions.
Product Managers need to evaluate 10 categories of Key Performance Indicators (KPIs) to determine the most appropriate KPIs relevant to their work:
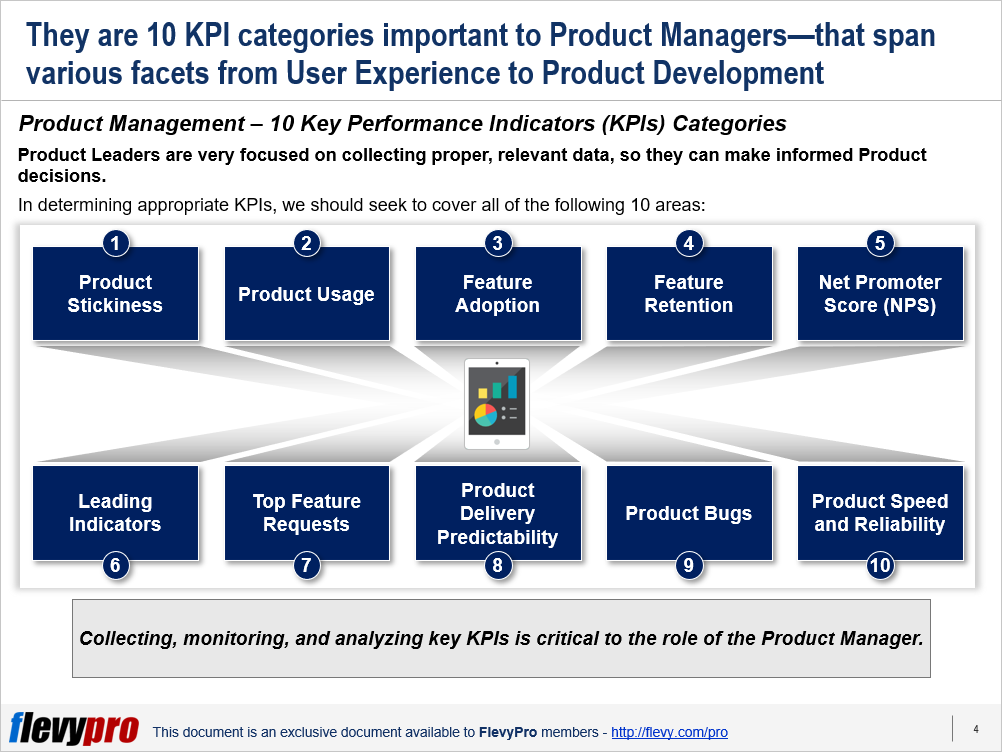
Let’s discuss these Product Management KPIs in a bit detail.
KPIs around Product Stickiness determine whether users are re-engaging with our product. If a product is successful, it exhibit “stickiness.” That means users don’t just sign up and forget about it. They continuously live inside the product, such that it becomes part of their daily routine. A good product should not long attract new users, but to also continuously re-engage with its users.
Product Stickiness is often measured by taking the ratio of our Daily Active Users (DAU) to Monthly Active Users (MAU): i.e., DAU/MAU. This metric calculates the percentage of our monthly users who engage with our product on a daily basis.
It is inevitable that not all features of a product will be utilized the same. Some features are more heavily used, whereas others are not. The only way to know what product features are important to users is by measuring how our product is being used. Measuring user engagement across the product allows us to answer what features should we enhance, which ones to eliminate, and which features to promote to increase users awareness of the product functionality.
Product usage is measured by using 3 key metrics—Breadth: refers to the number of active users for a given client within the last 90 days. Depth: Captures whether users are using key features that make the product sticky. Frequency: e.g., number of logins across all devices within the last 90 days.
These KPIs seek to understand and set feature adoption goals. Key question to clarify these KPIs is whether users are adopting the newly released features. Feature adoption data of recent feature launches is critical to determine appropriate feature adoption goals. It is important to look at feature adoption at both the user level and account level. For instance, different customer groups with an account may exhibit different levels of adoption for different feature sets.
The key metric to measure feature adoption is the percentage of users using the feature. This should be evaluated across multiple features on a timescale (typically for at least 30 days following the feature release).
Feature retention KPIs reveal true adoption of features vs. the initial promotion-driven adoption. Feature Adoption seeks to measure initial use of a feature, whereas Feature Retention seeks to measure the long-term, persistent usage of a feature. Measuring feature retention helps us identify at-risk users who have started to disengage from the product after the initial promotion is over. We can then take action to re-engage these users.
Feature retention can be measured across different customer segments, e.g., by pricing (Free vs. Paid), by organization size (Startups vs. Enterprises), by position (Analyst vs. Manager).
Interested in learning more about the other KPIs critical to manage and develop a Product Portfolio? You can download an editable PowerPoint presentation on Product Management KPIs here on the Flevy documents marketplace.
You can download in-depth presentations on this and hundreds of similar business frameworks from the FlevyPro Library. FlevyPro is trusted and utilized by 1000s of management consultants and corporate executives. Here’s what some have to say:
“My FlevyPro subscription provides me with the most popular frameworks and decks in demand in today’s market. They not only augment my existing consulting and coaching offerings and delivery, but also keep me abreast of the latest trends, inspire new products and service offerings for my practice, and educate me in a fraction of the time and money of other solutions. I strongly recommend FlevyPro to any consultant serious about success.”
– Bill Branson, Founder at Strategic Business Architects
“As a niche strategic consulting firm, Flevy and FlevyPro frameworks and documents are an on-going reference to help us structure our findings and recommendations to our clients as well as improve their clarity, strength, and visual power. For us, it is an invaluable resource to increase our impact and value.”
– David Coloma, Consulting Area Manager at Cynertia Consulting
“As a small business owner, the resource material available from FlevyPro has proven to be invaluable. The ability to search for material on demand based our project events and client requirements was great for me and proved very beneficial to my clients. Importantly, being able to easily edit and tailor the material for specific purposes helped us to make presentations, knowledge sharing, and toolkit development, which formed part of the overall program collateral. While FlevyPro contains resource material that any consultancy, project or delivery firm must have, it is an essential part of a small firm or independent consultant’s toolbox.”
– Michael Duff, Managing Director at Change Strategy (UK)
What is strategy without execution? Merely theory.
A successful business requires both a well developed strategy and the ability to execute on that strategy. Many companies develop robust strategies, but fail at operationalizing their strategies into implementable steps.
Flevy has just released a free primer on the topic Strategy Development and Strategy Execution. It is a 54-slide deck that discusses 12 frameworks, spanning both strategy development and execution.
Topics covered include: Porter’s Five Forces, Consolidation-Endgame Curve, Hoshin Kanri, Product Lifecycle, Consumer Adoption Curve, Balanced Scorecard, Blue Ocean Strategy, BCG Matrix, SWOT, PEST, Marketing Mix, and Organizational Hurdles.
You may also be interested in Flevy’s business toolkits focused on these topics:
You browse their other business toolkits here: http://flevy.com/business-toolkits