 Become a PowerPoint Guru by Dave Tracy
Learn the methodologies, frameworks, and tricks used by Management Consultants to create executive presentations in the business world.
Become a PowerPoint Guru by Dave Tracy
 Supply Chain Management across industries has become way too complicated and globalized today. Since the popularity and use of Social Media has grown, organizations are increasingly getting under pressure to disclose their information publicly. This pressure on information transparency has reached a level where external stakeholders expect to know the details of an organization’s Supply Chain practices much more than what is typically required to disclose legally.
Executives are finding it hard to deal with this situation. A majority of them have a limited understanding of the salient features and capabilities of their own Supply Chains, lack the expertise to gather and report Supply Chain data, and fail to develop a Supply Chain Information Disclosure Strategy.
To begin with, they need to first realize the forces that are pushing this trend for information transparency—government regulations, laws, competitors’ best practices, and non-governmental organizations (NGOs). NGOs often highlight media campaigns to expose poor Supply Chain practices carried out by organizations. These campaigns may have adverse effects on brand reputation.
Once a fair understanding of these forces has been established, only then executives can develop approaches to deal with these information transparency trends effectively.
The growing demand and understanding of organizations to make Supply Chain information transparent warrants them to have an in-depth know how of what is required to accomplish this and the constraints therein—e.g., their data collection capabilities, the resources required to establish reporting systems, the technology requisites, and clearly defined standards for reporting systems.
Supply Chain Management experts identify 4 categories of Supply Chain information that organizations can publicly disclose:
![]()
This category pertains to information related to the suppliers. It includes basic supplier information, e.g., the names of first-tier direct suppliers and supplier locations. For instance, Nike shares a list of its global suppliers for the entire product range with names, locations, workforce composition, and subcontracting status of every supplier.
This category entails information related to ensuring compliance of materials used to produce products with regulatory standards. Specifically, this includes source (material) locations, material extraction practices, and compliance with safety and quality standards.
This category pertains to reports on environmental measures, including carbon and energy usage levels, water use, air pollution, and levels of waste in the Supply Chain.
This category entails reports on labor policies (health & safety conditions, work hours), human rights data, and social impacts of the Supply Chain (community involvement and development work).
There is no one-size-fits-all approach to information disclosure that suits every firm. Once senior management has evaluated the leading best practices on types of Supply Chain information that can be shared publicly, their emphasis should be on determining and agreeing on the level of Supply Chain information disclosure that is ideal for their organization. Senior executives can select a viable strategy from the following 4 typical Supply Chain Information Disclosure Strategies:
This strategy involves maximum public availability of all Supply Chain information. Companies following the “Transparent” strategy regard information disclosure as a core competence. They take full disclosure of their Supply Chain information as a commitment to satisfy external stakeholders.
For instance, Nike was criticized throughout the 1990s for poor working conditions in its Supply Chain, but now it is recognized as a leader for its responsible supply chain membership, provenance, environmental, and social sustainability information disclosure.
Interested in learning more about the remaining Supply Chain Information Transparency Strategies? You can download an editable PowerPoint on Supply Chain Information Transparency Strategies here on the Flevy documents marketplace.
You can download this and hundreds of other consulting frameworks and consulting training guides from the FlevyPro library.
 Reducing the fragility of global Supply Chains in the event of disruption through natural or other disasters is a major concern for most senior executives. This rings true more so now than ever, as the world grapples with COVID-19, the worst human health crisis in 100 years.
The strategies to enhance the effectiveness and readiness level of Supply Chains and to reduce risks associated with disruption come with a price. These costs are critical to build Supply Chain Resilience across all industries.
However, these expenses are, generally, considered a hindrance in the implementation of risk reduction strategies by many leaders. This is one of the major factor that precludes them from anticipating and managing Supply Chain Risks.
Able leaders anticipate these risks and invest in building organizational resilience. They leverage a couple of potent Supply Chain Risk Reduction Strategies that have nominal impact on cost efficiency but offer substantial reduction of disruption risks:
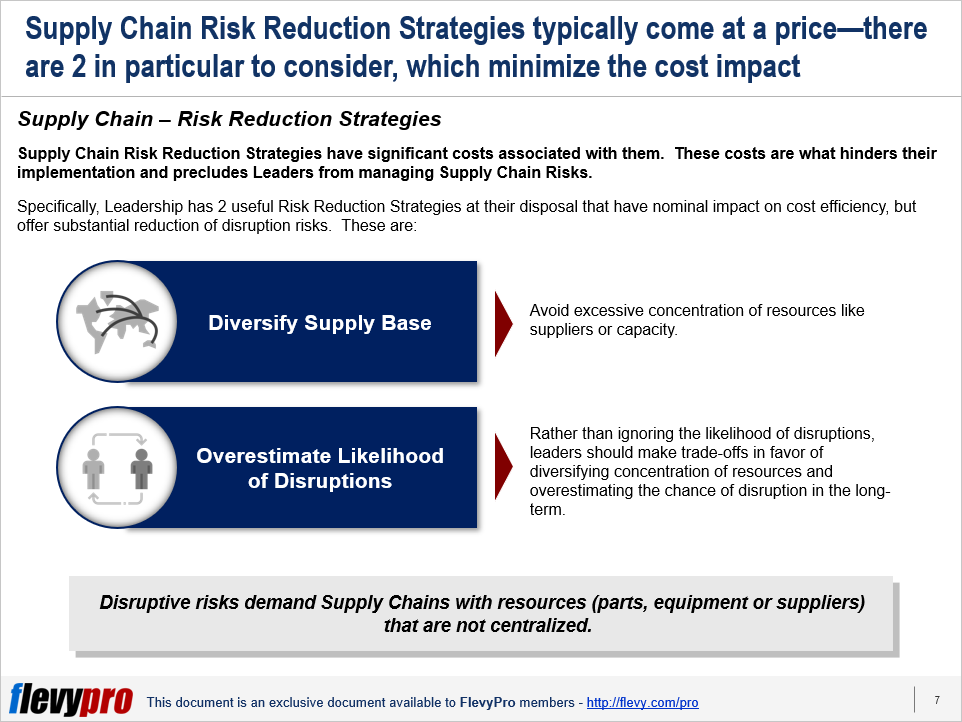
It is vital for organizations to diversify their supplier base to avoid disruption of their Supply Chains in the event of a natural disaster. Manufacturers have been found to have been using pooling—combining resources, inventory and capacity by maintaining fewer distribution centers—and producing common parts to help reduce costs. However, too much pooling and commonality can make the Supply Chain vulnerable to disruption.
For instance, relying too much on a single supplier and common parts—in an effort to be as lean and efficient as possible—became a Supply Chain Analysis nightmare and cost Toyota billions of dollars in terms of lost sales and product recalls in 2010. Back then, the auto manufacturer was counting on a single supplier for a common part for many of its car models, which was effective in curtailing costs, but turned out to be a disaster.
Organizational leadership should evaluate the trade-offs between having a leaner and efficient Supply Chain—with common parts and single suppliers—and preparing for and reducing the risks of disruptions. Minimizing the number of distribution centers offers diminishing marginal returns for Supply Chain Performance and increases the Supply Chain Fragility. Creating little bit of commonality presents significant advantages, but when more parts are made common the benefits shrink and it rather becomes detrimental.
The key for senior leaders is to find an optimal balance between resource pooling, creating common parts, and deciding on whether to decentralize or centralize their Supply Chains. Decentralization (e.g., by having multiple warehouses or plants) increases costs as it requires more inventory, but it does curtail the effect of disruption significantly. Centralization or pooling of resources, on the other hand, reduces total costs, but the cost again goes up by centralizing beyond a reasonable degree. Recurrent Supply Chain Risks necessitate focusing more on centralization and pooling of resources and commonality of parts, while rare disruptive risks necessitate decentralization. Achieving a state of equilibrium between pooling of resources, parts commonality or fewer plants helps keep Supply Chain Risks low. Ignoring the possibility of disruption can be very expensive in the long term. Samsung Electronics Co. Ltd. always maintain at least two suppliers, no matter if the second supplier supplies only a fraction of the volume.
The risk of disruption of supply chains due to any unforeseen event is typically considered a rare possibility and goes unaccounted for during planning by most executives. A fire break out at a distribution center, defective auto part, or a supplier’s facility closure for a prolonged period of time can happen anywhere, but we tend to underestimate the likelihood of such events. The reason for this is attributed to the requirement of assigning a significant chunk of investments upfront from the already limited resources and budgets, to prepare for and mitigate likely disruptive risks.
Most of our typical risk assessment measures involve approximating the probability and the likely damage caused by an event. Estimating the likelihood of disruptive risk to a reliable degree isn’t easy even for large multinationals—even an auto manufacturer like Toyota could not anticipate the occurrence of the part failure issue until the damage had been done. These risk estimations do not have to be strictly precise. Rough estimates of disruption risk are fine—any small mis-estimates that occur have negligible consequences.
Senior leadership needs to cautiously contemplate the areas that are likely to get affected the most due to potential disruption. Building resilience does not cost much for large organizations. In the long term, doing nothing costs much more than investing in preparing for a probable disruption. When disruption occurs, the loss incurred greatly exceeds the amount of saving executives save by not investing in risk mitigation strategies.
Interested in learning more about the subject in detail? You can download an editable PowerPoint on Supply Risk Reduction Strategies here on the Flevy documents marketplace.
You can download this and hundreds of other consulting frameworks and consulting training guides from the FlevyPro library.
Supply Chains often get disrupted by calamities that are beyond human control. Natural disasters, such as tsunamis and floods, in the last decade have drastically affected major businesses—from automobiles to technology, to travel, to shipments—and exposed critical weaknesses in Supply Chain mechanisms around the globe. And, now, we are living through a global disruption of an unparalleled nature, COVID-19.
Organizations that rely on single-source suppliers, common parts, and centralized inventories are more susceptible to the risk of disruption.
Management in most cases is aware of its responsibility to prevent their Supply Chains from getting disrupted by ensuring measures such as keeping enhanced stocks, improving capacity at discrete facilities, and choosing multiple sources. But these measures have a negative effect on Supply Chain cost efficiencies.
However, discerning the effects of costly Supply Chain disruptions is one thing and taking actions to avoid such situations or mitigating their undesirable effects is another. Managing Supply Chain risks necessitates careful evaluation of the impact that these measures have on Supply Chain cost efficiencies and bottom line. During the COVID-19 pandemic, it has become clearer than ever that Supply Chain Management must also involve this form of Risk Management.
Supply Chain Efficiency entails improving the financial performance of an organization and focusing on improving the way we manage supply and demand. Demand fluctuations or supply delays are independent and can be typically tackled by having appropriate inventory levels in the right place, better planning and implementation, and improving Supply Chain Cost Efficiency.
Supply Chains are complex operations encompassing many products or commodities that are sourced, manufactured or stored in multiple locations. These complexities can slash efficiency, cause delays, suspension of operations, and increased risk of disruption. Containing complexities brings higher cost efficiencies and reduced risks.
Supply Chain Containment ensures that Supply Chain disruptions caused by internal factors or through natural hazards are contained within a portion of the Supply Chain. A single Supply Chain for the entire organization seems cost effective in the short term, but even a small issue can trigger a disaster.
Supply Chain Containment Strategies are useful for the organizations to design and deploy solutions fairly quickly in the event of disruption through natural disasters. The objective is to limit the impact of disruption through disasters to a minimum—to just a portion and not the entire Supply Chain.
For instance, in order to reduce the impact of parts shortage, a mechanical parts manufacturer should arrange multiple supply sources for common items or limit the number of common items across different models. To reduce Supply Chain instability and to improve financial performance, organizations can use the following containment strategies:
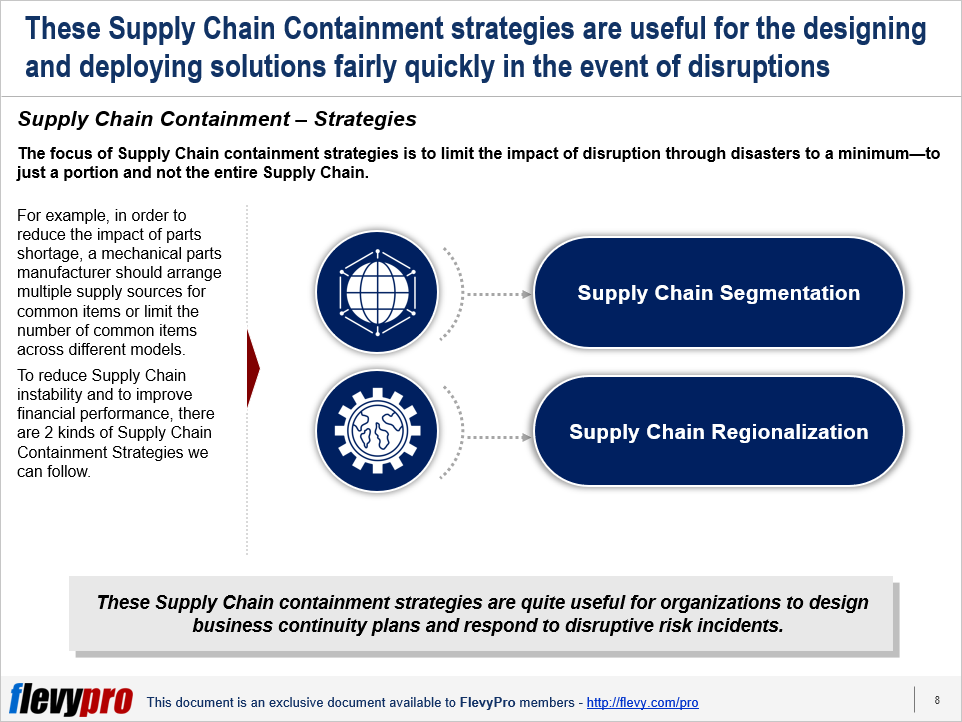
The basis for Supply Chain segmentation are volume, product diversity and demand uncertainty. High margin but low-volume products with high-demand uncertainty warrant keeping Supply Chains flexible, with capacity that is centralized to aggregate demand. Manufacturing everything in high-cost locations is detrimental to profit margins. Sourcing responsive suppliers from Europe is a model feasible for trendy high-end items only. For fast-moving, low margin, basic products it is sensible to source from multiple low-cost suppliers. Centralization is favorable in case of fewer segments, significant product variety, low sales volumes of individual products, and high demand uncertainty to achieve reasonable levels of performance. Decentralization is suitable in case of higher sales volumes, less demand uncertainty, and more segments, to help become more responsive to local markets and reduce the risk of disruption. For instance, utility companies utilize low-cost coal-fired power plants to handle predictable demand, whereas employ higher-cost gas- and oil-fired power plants to handle uncertain peak demand.
Supply Chain Regionalization helps curtail the impact of losing supply from a plant within the region. For instance, Japanese automakers were badly hit by shortage of parts globally in the event of 2011 tsunami, since most of these parts could be sourced only from storage and distribution facilities in the tsunami-affected regions. Had they operated with decentralized regional Supply Chains with logistics centers dispersed in various locations they would have significantly contained the impact of disruption.
Supply Chain Regionalization lowers distribution costs while also reducing risks in global Supply Chains. During periods of low fuel and transportation costs, global Supply Chains minimize costs by locating production where the costs are the lowest. As transportation costs rise, global Supply Chains may be replaced by regional Supply Chains. Regionalized Supply Chains with same inventory stored in multiple locations appear wasteful, but are more robust in case one of the logistics centers suffers from a disaster.
Interested in learning more about the Supply Chain Segmentation and Regionalization? You can download an editable PowerPoint on Supply Chain Containment Strategies here on the Flevy documents marketplace.
You can download this and hundreds of other consulting frameworks and consulting training guides from the FlevyPro library.
Enterprises invest in Analytics to improve Decision Making and outcomes across the business. This is from Product Strategy and Innovation to  Supply Chain Management, Customer Experience, and Risk Management. Yet, many executives are not yet seeing the results of their Analytics initiatives and investments.
Every organization putting on investment in Analytics has experienced several stumbling blocks. This differentiates the leaders from the laggards. Analytics-driven Organizations have clearly established processes, practices, and organizational conditions to achieve Operational Excellence. Their commitment to Analytics is creating a major payoff from their investments and a competitive edge.
The Harvard Business Review Analytic Services conducted a survey of 744 business executives around the world and across a variety of industries. Their focus was on the performance gap between companies that have struggled to get a return on their Analytics investment and those that have effectively leveraged their investment.
The survey showed that Analytics-driven Organizations get sufficient return on investment in Analytics. In fact, they have been highly successful in gaining a return on Analytics investment. This is gainfully achieved as organizations use Analytics consistently in strategic decision making. Executives of Analytics-driven Organizations rely on Analytics insights when it contradicted their gut feel.
Essentially, Analytics-driven Organizations have reduced costs and risks, increased Productivity, Revenue, and Innovation, and have successfully executed their Strategy. Yet, in evolving the organization’s Analytics approach, there can be 4 core obstacles that can affect their drive to getting a greater return on investment in Analytics.
There are 4 core obstacles to being an Analytics-driven Organization.
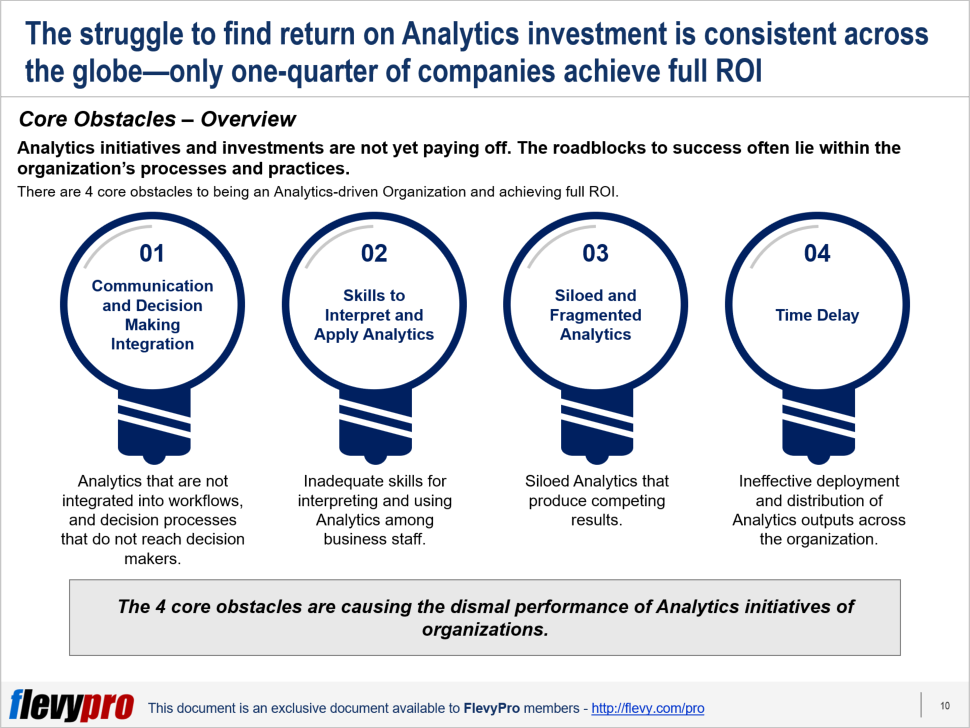
Let’s briefly take a look at the first 2 obstacles:
The other two core obstacles are siloed and fragmented Analytics and time delay. These are two equally important core obstacles that can hinder the use of Analytics to maximize return on investment. Further, the 4 core obstacles are barriers to analytic success.
Leaders use Analytics consistently in decision making. In fact, based on the survey, 83% of executives use it in business planning and forecasting. On the other hand, laggards only use it 67% of the time. Even in various aspects of the organization such as Marketing, Operations, Strategy Development, Sales, Supply Chain, Pricing and Revenue Management, and Information Technology, laggards use Analytics only half the time compared to Analytics Leaders.
Analytics Leaders always ensure that they establish the processes and organizational conditions to allow them to successfully deploy Analytics. In fact, to increase return on Analytics, organizations must undertake the use of four interrelated initiatives that will drive greater return on investment Analytics. These are four initiatives essential to building an Analytics-driven Organization.
One is building an organizational culture around Analytics. To achieve this the organization must have clear, strategic, and operational objectives that are set for Analytics. Second is deploying Analytics throughout all core functions of the business.
Starting with an Analytics-driven Culture can greatly facilitate cross-functional deployment of Analytics.
Interested in gaining more understanding of Analytics-driven Organization? You can learn more and download an editable PowerPoint about Analytics-driven Organization here on the Flevy documents marketplace.
Are you a management consultant?
You can download this and hundreds of other consulting frameworks and consulting training guides from the FlevyPro library.