 Accelerated pace of technological disruption has forced organizations to change. It has triggered leaders to think of the ways they must adopt to survive in these challenging times.
Organizations are confronting this scenario by embracing digital technologies. Traditionally, the focus of the organizations in these Transformation initiatives has remained on speed of change. To get the most out of their initiatives, they are making drastic changes, to include:
- Creating Agile Teams
- Introducing Mobile Apps
- Building Big Data and Analytics capabilities
- Experimenting with creative Digital Business Models.
Digital Transformation programs are launched with huge fanfare, see success early on, but fail to keep the momentum going. The issues that plague the sustainability of these initiatives are typically:
- Aging Technology Infrastructure
- Incompatible Operating Models
- Archaic ways of doing business
- Change-agnostic culture.
Drivers of change for the Digital Leadership have changed significantly over the years. There is an increased focus on building scale when executing Digital Transformation. Leaders have realized that quick Decision Making is not the only element required for successful Transformation. To achieve its full potential, they need to create differentiated offerings and scale the most viable initiatives across the organization to create value.
Traditional organizations have started following the footsteps of digital disrupters like Amazon and Tesla. They are implementing new digital services and adjusting their operations. However, typical hurdles—e.g., old enterprise systems, bureaucratic red tape, delayed decision making, and segregation between IT and business units—make them slip back into the outdated ways of doing things.
Sustainable Digital Transformation involves building not only the technology infrastructure but also revisiting the operating model. Successful Digital Transformations essentially involve embracing 4 key strategies to enable an ecosystem that encourages change to stick as well as scale:
- Create a strong Digital Foundation
- Integrate and consolidate the Digital Ecosystem
- Front-end to back-end approach
- Create a new Business Model
![]()
Let’s delve deeper into these strategies.
Create a Strong Digital Foundation
Manufacturing and pharmaceutical industries are the major sectors that employ this strategy. The typical state of affairs in organizations implementing this strategy is such that they are in need of developing new digital capabilities from scratch to tackle nimble rivals who are churning out novel value propositions using digital tech. These companies are burdened by dated tech infrastructure, sluggish decision making, and dated business models. The risk of disruption to these businesses is growing but it hasn’t challenged them to transform drastically.
To them, building a digital foundation warrants acquiring novel foundational capabilities. Their approach should be to start implementing and managing small changes one step at a time. For instance, building a smart technology architecture with advanced Big Data, Analytics, and predictive modeling capabilities. This should be followed by testing prototypes of the new model to prove their worth before implementing a full-blown execution.
Integrate and Consolidate the Digital Ecosystem
This strategy has gained traction most in organizations from the Consumer Products industry. These organizations are typically marred by scores of fragmented IT systems running in different parts of the organization. There is a general inability to prioritize the most viable projects and scale them. The need to reform and rapid deployment of Digital Infrastructure is critical for survival.
The approach to Digital Transformation in these organization should be to establish a central management position to manage the initiative and streamline dispersed technology landscape. This entails revising the technology infrastructure and operating model, deploying a unified IT platform for gathering and storing customer data, establishing a common data repository accessible to all units to recognize customers’ needs, and creating a culture that encourages innovation, acts on creative ideas, and refines them through experimentation and advanced tools.
Interested in learning more about the other strategies to enable Digital Transformation? You can download an editable PowerPoint on Sustainable Digital Transformation here on the Flevy documents marketplace.
Did You Find Value in This Framework?
You can download in-depth presentations on this and hundreds of similar business frameworks from the FlevyPro Library. FlevyPro is trusted and utilized by 1000s of management consultants and corporate executives. Here’s what some have to say:
“My FlevyPro subscription provides me with the most popular frameworks and decks in demand in today’s market. They not only augment my existing consulting and coaching offerings and delivery, but also keep me abreast of the latest trends, inspire new products and service offerings for my practice, and educate me in a fraction of the time and money of other solutions. I strongly recommend FlevyPro to any consultant serious about success.”
– Bill Branson, Founder at Strategic Business Architects
“As a niche strategic consulting firm, Flevy and FlevyPro frameworks and documents are an on-going reference to help us structure our findings and recommendations to our clients as well as improve their clarity, strength, and visual power. For us, it is an invaluable resource to increase our impact and value.”
– David Coloma, Consulting Area Manager at Cynertia Consulting
“FlevyPro has been a brilliant resource for me, as an independent growth consultant, to access a vast knowledge bank of presentations to support my work with clients. In terms of RoI, the value I received from the very first presentation I downloaded paid for my subscription many times over! The quality of the decks available allows me to punch way above my weight – it’s like having the resources of a Big 4 consultancy at your fingertips at a microscopic fraction of the overhead.”
– Roderick Cameron, Founding Partner at SGFE Ltd

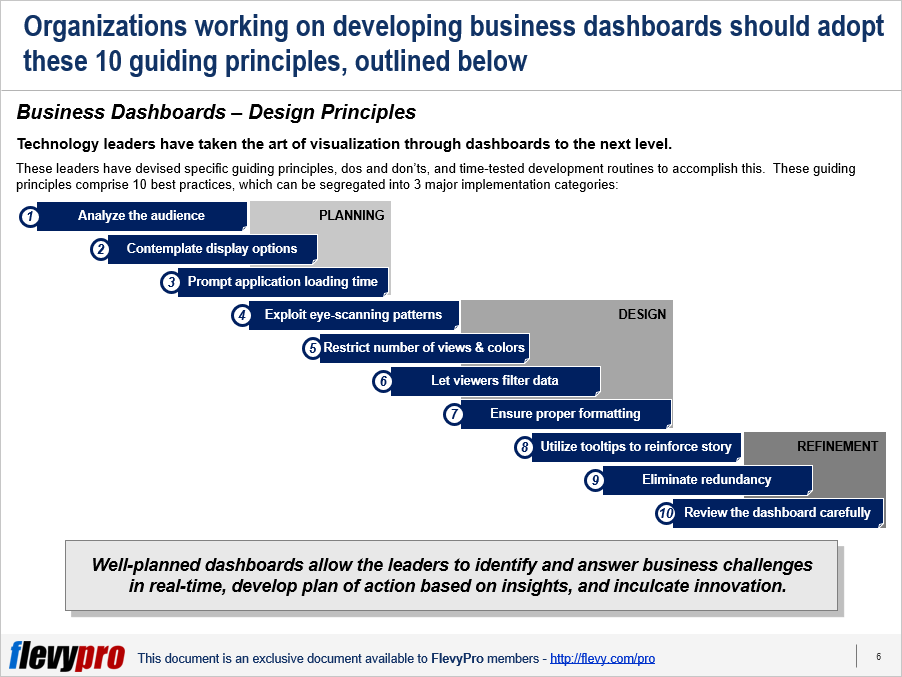
 Business dashboards