Currently viewing the tag: "cost management"

Editor’s Note:  If you are interested in becoming an expert on Strategy Development, take a look at Flevy’s Strategy Development Frameworks offering here.  This is a curated collection of best practice frameworks based on the thought leadership of leading consulting firms, academics, and recognized subject matter experts. By learning and applying these concepts, you can stay ahead of the curve.  Full details here.

* * * *

10039968067?profile=RESIZE_400xA question faced by many business leaders in today’s dynamic, uncertain, and changing business environment is:  Is our organization “Fit for Growth?”  In most cases, unfortunately, the answer to this question is “no.”  Reasons include the manner in which costs are managed and resources deployed.

The fundamental question needed to be asked is: how to assess whether the organization is Fit for Growth?  Such an assessment is effortlessly possible through answering the following 3 questions:

  1. Does the company have well-defined Strategic Priorities that concentrate on strategic growth and which direct its investments?
  2. Do the company costs align with the Strategic Priorities? i.e., efficient and effective employment of resources toward the Priorities.
  3. Does the Organizational Structure enable achievement of those Strategic Priorities?

Imagining the converse side of these queries makes the picture clearer.  That is, what are the consequences of: Not having clear Priorities, Inappropriate deployment of Costs, Not having a well-designed organization.

Positioning the company to be Fit for Growth requires basing it on the following 3 pillars of Growth:

  1. Set clear Strategic Priorities.
  2. Transform Cost Structure.
  3. Reorganize for Growth.

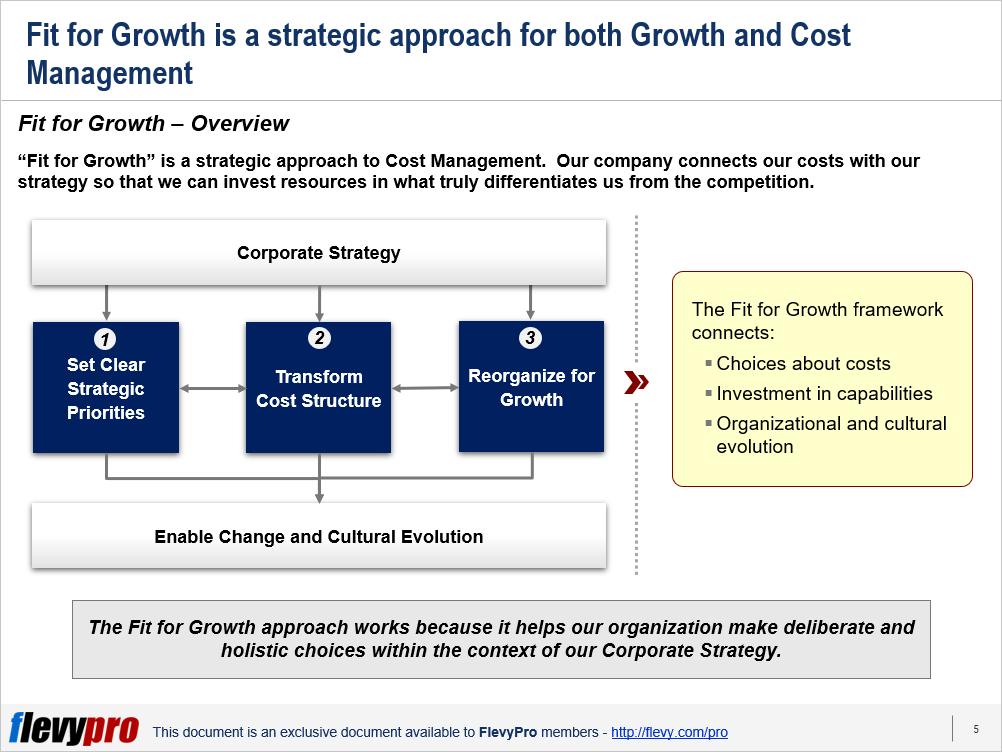
Setting the company on the 3 pillars enables it to direct investments towards the Capabilities that are most crucial and reduce—or eradicate—other costs. 

Let us delve a little deeper into the details of these 3 pillars. 

Strategic Priorities

Numerous warning indicators are apparent if the Strategic Growth Priorities of a company are not crystalized.

Warning signs such as being unable to keep track of the numerous initiatives that the company has going at the same time.

Senior executives of the company attending lots of unrelated meetings in a day.  Executives being divergent on the most important capabilities of the company and how they relate to the strategic objectives.

Areas that can distinguish the company from its competitors not being properly invested in.

Research has established an important correlation between Capabilities and Strategy.  Capabilities require lots of attention and investment because of their cross-functional effect and limited number.

It is therefore, needed to have clear Priority regarding which Capabilities to invest in.

Cost Structure

Inappropriate Costs Structure is also an indicator of incorrect priorities, particularly the amount spent on non-essentials.  

Organizations aiming to be Fit for Growth make themselves lean and expend money purposefully.  They can maintain their commanding position in such Cost Transformations by pursuing the 12 principles.

Costs are managed for efficiency as well as effectiveness using tools and practices that are usually grouped into 3 categories.

Growth

Organizations, over time, become slow in reacting to opportunities and do not move quickly enough, or are not in-line enough to work in unison.  These are common manifestations, even in organizations that are run and managed well.

Interested in learning more about Fit for Growth?  You can download an editable PowerPoint on Fit for Growth here on the Flevy documents marketplace.

Want to Achieve Excellence in Strategy Development?

Gain the knowledge and develop the expertise to become an expert in Strategy Development.  Our frameworks are based on the thought leadership of leading consulting firms, academics, and recognized subject matter experts.  Click here for full details.

“Strategy without Tactics is the slowest route to victory. Tactics without Strategy is the noise before defeat.” – Sun Tzu

For effective Strategy Development and Strategic Planning, we must master both Strategy and Tactics.  Our frameworks cover all phases of Strategy, from Strategy Design and Formulation to Strategy Deployment and Execution; as well as all levels of Strategy, from Corporate Strategy to Business Strategy to “Tactical” Strategy.  Many of these methodologies are authored by global strategy consulting firms and have been successfully implemented at their Fortune 100 client organizations.

These frameworks include Porter’s Five Forces, BCG Growth-Share Matrix, Greiner’s Growth Model, Capabilities-driven Strategy (CDS), Business Model Innovation (BMI), Value Chain Analysis (VCA), Endgame Niche Strategies, Value Patterns, Integrated Strategy Model for Value Creation, Scenario Planning, to name a few.

Learn about our Strategy Development Best Practice Frameworks here.

Do You Find Value in This Framework?

You can download in-depth presentations on this and hundreds of similar business frameworks from the FlevyPro Library.  FlevyPro is trusted and utilized by 1000s of management consultants and corporate executives.  Here’s what some have to say:

“My FlevyPro subscription provides me with the most popular frameworks and decks in demand in today’s market.  They not only augment my existing consulting and coaching offerings and delivery, but also keep me abreast of the latest trends, inspire new products and service offerings for my practice, and educate me in a fraction of the time and money of other solutions.  I strongly recommend FlevyPro to any consultant serious about success.”

– Bill Branson, Founder at Strategic Business Architects

“As a niche strategic consulting firm, Flevy and FlevyPro frameworks and documents are an on-going reference to help us structure our findings and recommendations to our clients as well as improve their clarity, strength, and visual power.  For us, it is an invaluable resource to increase our impact and value.”

– David Coloma, Consulting Area Manager at Cynertia Consulting

“FlevyPro has been a brilliant resource for me, as an independent growth consultant, to access a vast knowledge bank of presentations to support my work with clients.  In terms of RoI, the value I received from the very first presentation I downloaded paid for my subscription many times over!  The quality of the decks available allows me to punch way above my weight – it’s like having the resources of a Big 4 consultancy at your fingertips at a microscopic fraction of the overhead.”

– Roderick Cameron, Founding Partner at SGFE Ltd

Stock Image 2 - Business Transfromation CSFsBusiness Transformations have become a necessity in the fast-changing technological and competitive business environment.  Transformation is characterized by significant and risk-laden Restructuring of a company, with the objective of accomplishing Operational Excellence and changing its future course.

Business Transformation is a priority for many top executives but it is usually a reaction to challenging circumstances rather than being a preemptive measure.

Business Transformation is prompted by a combination of 2 situations:

  • Need to address inherent problems causing organizational drag—these problems may be internal and/or external.
  • Aspiration by the top management and other senior stakeholders to seize the occasion of addressing these problems, in ways that deeply alter the Business Model of the organization including Value Creation.

Business Transformation entails not just making incremental changes but fundamentally changing all or some of the following:

  • Organizational Structure
  • Core Product or Service Portfolio
  • Systems
  • Processes
  • People—the way employees work
  • Technology

Undertaking such arduous effort requires approaching the task in a structured way.  Research shows that quite a few of such undertakings are based on anecdotal beliefs instead of being based on empirical data.

Countering this trend, the Boston Consulting Group conducted an empirical study of financial and non-financial data-set comprising 300 U.S. public companies.  The data spanned a period of 12 years from 2004 to 2016.  Selection was based on the following criteria:

  • Companies that had a $10 billion or more market capitalization between 2004 and 2016.
  • Of these, companies with an annualized deterioration in Total Share-holder Return (TSR) of 10% or more relative to their industry average (2 years running or more) were identified.

Based on extensive analysis—that included use of methodologies like trained proprietary algorithms, prediction models, and Multivariate Regression Analysis—a pattern pertaining to Business Transformation emerged.  The pattern depicted the following themes:

  1. Frequency of Failure
  2. Impact of Digital Disruption
  3. Impact of Downturn
  4. Competitive Volatility

The study also suggested the following 5 evidence-based Critical Success Factors (CSFs) for achieving Transformation Success.

  1. Cost Management (drives short-term success)
  2. Revenue Growth (drives long-term success)
  3. Long-term Strategy and R&D Investment
  4. New, External Leadership
  5. Holistic Transformation Programs

Let us examine in a bit more detail some of the CSFs.

Cost Management

In order to launch the Transformation effort on the correct footing, Cost Management is key, in the short term especially.  Predictably, empirical analysis suggests that the leading driver for organizations recovering from severe TSR deterioration is a determined Cost-cutting effort during the 1st year of Turnaround.  By year 3, Cost Reduction is accountable for the major share of TSR growth as companies divert their portfolios and make available funding for growth investments.

Revenue Growth

Merely short-term operational improvements do not augur well for a sustainable Transformation.  There has to be a long-term Growth Strategy put in place.  For this to happen, leaders have to challenge the foundations of the company’s Business Model.

Research divulges that Revenue Growth progressively becomes the driver for TSR recovery after year 1 in all the successful Transformation efforts.  Revenue Growth overshadows, by far, all the initial drivers for TSR recovery by year 5 of all successful Turnaround efforts.

Long-term Strategy and R&D Investment

Turbulent competitive environments, particularly, require long-term Strategic Planning and investment in Research and Development for fruitful Business Transformations.  Empirical research and analysis demonstrates:

  • A 4.8% difference between Transforming companies showing above-average long-term strategic direction compared to companies with a below-average orientation.
  • More pronounced findings in transforming companies operating in turbulent competitive environments—long-term orientation linked with a TSR increase of 7%.
  • Companies with above-average R&D investments had upwards of 5.1% TSR impact in contrast to those with below-average spending.

These CSFs strengthen the odds of success in Business Transformation individually.  When used together, most of them produce an impact that is larger than the totality of their individual parts.

Interested in learning more about the 5 Critical Success Factors for Successful Business Transformation?  You can download an editable PowerPoint on 5 Critical Success Factors for Successful Business Transformation here on the Flevy documents marketplace.

Want to Achieve Excellence in Business Transformation?

Gain the knowledge and develop the expertise to become an expert in Business Transformation.  Our frameworks are based on the thought leadership of leading consulting firms, academics, and recognized subject matter experts. Click here for full details.

“If you don’t transform your company, you’re stuck.” – Ursula Burns, Chairperson and CEO of VEON; former Chairperson and CEO of Xerox

Business Transformation is the process of fundamentally changing the systems, processes, people, and technology across an entire organization, business unit, or corporate function with the intention of achieving significant improvements in Revenue Growth, Cost Reduction, and/or Customer Satisfaction.

Transformation is pervasive across industries, particularly during times of disruption, as we are witnessing now as a result of COVID-19.  However, despite how common these large scale efforts are, research shows that about 75% of these initiatives fail.

Leverage our frameworks to increase your chances of a successful Transformation by following best practices and avoiding failure-causing “Transformation Traps.”

Learn about our Business Transformation Best Practice Frameworks here.

Do You Find Value in This Framework?

You can download in-depth presentations on this and hundreds of similar business frameworks from the FlevyPro Library.  FlevyPro is trusted and utilized by 1000s of management consultants and corporate executives. Here’s what some have to say:

“My FlevyPro subscription provides me with the most popular frameworks and decks in demand in today’s market.  They not only augment my existing consulting and coaching offerings and delivery, but also keep me abreast of the latest trends, inspire new products and service offerings for my practice, and educate me in a fraction of the time and money of other solutions.  I strongly recommend FlevyPro to any consultant serious about success.”

– Bill Branson, Founder at Strategic Business Architects

“As a niche strategic consulting firm, Flevy and FlevyPro frameworks and documents are an on-going reference to help us structure our findings and recommendations to our clients as well as improve their clarity, strength, and visual power.  For us, it is an invaluable resource to increase our impact and value.”

– David Coloma, Consulting Area Manager at Cynertia Consulting

“FlevyPro has been a brilliant resource for me, as an independent growth consultant, to access a vast knowledge bank of presentations to support my work with clients.  In terms of RoI, the value I received from the very first presentation I downloaded paid for my subscription many times over!  The quality of the decks available allows me to punch way above my weight – it’s like having the resources of a Big 4 consultancy at your fingertips at a microscopic fraction of the overhead.”

– Roderick Cameron, Founding Partner at SGFE Ltd

cost to serve 1Supply chain management across industries is being revolutionized at a rapid pace by technology.  By implementing technology systems, supply chain organizations aspire to eliminate waste, meet customers’ needs at reasonable costs, and ensure profitability.  Enterprise Resource Planning systems facilitate in processing unstructured data at an aggregated level.  However, at workflow or micro level the data produced through ERPs needs to be further refined to understand costs.

Supply chain experts need to look at their unstructured data and understand the cost of offering a product; know which product mix they should promote; and gauge the impact of service levels on transportation costs, profits, and pricing strategy.

Supply Chain Executives can use the Cost-to-Serve (CTS) Analysis approach to control distribution costs, identify negative-margin products, and prevent profit leakages.  CTS Analysis affords the organizations the means to identify the total cost of serving customers—including all the costs in a product’s value chain (from raw material to delivery)—at the product as well as customer levels.  The approach helps leaders split and evaluate individual customers, geographies, products, product families, or combinations of products / customers.

The Cost-to-Serve Analysis can be undertaken to identify costs related to Supply Chains, Logistics, Distribution, Warehousing, or Transportation.  CTSA allocates indirect cost to products—overhead or fixed costs that are not easily and directly attributable to a single order, shipment, or activity.

The CTS model for costing entails detailed modeling of all the value and non-value added activities in the process.  The approach is more precise than other methods in determining “what-if” budgets, as it accounts for all the activities and link them with their relevant cost pools.  CTS employs an activity-based modelling algorithm—which segregates the entire supply chain into multiple tasks while calculating the costs at every task—to help the supply chain practitioners calculate costs at various levels.

The CTS Framework entails 5 fundamental steps:

  1. Obtain Buy-in from Key Stakeholders
  2. Conduct Cost Categorization
  3. Determine per Unit Cost Breakdown
  4. Develop Classification Matrices
  5. Make Joint Decisions

Let’s delve deeper into the first 2 steps of the CTS Framework.

1. Obtain Buy-in from Key Stakeholders

The first step to implement Cost-to-Serve Framework involves getting across-the-board agreement and stakeholder buy-in.  The decision to calculate the impact of cost to serve on revenue entails engagement and collaboration from multiple departments in a company.  Multiple cost centers work in partnership across a value chain and thus profit and loss responsibility cannot be attached to a specific unit.

For instance, a decision to trim down the costs to serve a customer (or various customers) has to be agreed upon by stakeholders from the:

  • Sales and marketing department to calculate the impact of service level agreements.
  • Logistics function to calculate the cost impact.
  • Go-to-market Strategy to ensure alignment with Corporate Strategy
  • Warehousing unit to ensure resource planning and allocation.

2. Conduct Cost Categorization

The 2nd step of the Cost-to-Serve Framework involves categorization of costs associated with the entire supply chain.  Supply chains typically have various cost centers (or functions): e.g., Procurement, Manufacturing, Warehousing, and Logistics.  These cost centers further have multiple processes with costs associated with all of them.  CTS requires top-down estimation of costs at the process and activity level and then aggregate those back to the cost center level.

This categorization of costs across the various functions of the supply chain and their associated processes facilitates in accurate calculation and obtaining estimates at the micro level.

Interested in learning more about the other steps of the Cost-to-Serve Framework?  You can download an editable PowerPoint presentation on Cost-to-Serve Analysis here on the Flevy documents marketplace.

Are you a Management Consultant?

You can download this and hundreds of other consulting frameworks and consulting training guides from the FlevyPro library.

CostingCost-based Pricing is fast becoming a relic of the past and being substituted by the concept of Target Costing.  Target Costing is referred to as an organized process to determine the cost at which a proposed product must be developed so as to generate profits at the product’s anticipated selling price in future.

In highly competitive markets such as FMCG, construction, healthcare, and energy, prices are determined by market forces.  Producers cannot effectively control selling prices.  The only control, to some extent, is over costs, so management’s focus has to be on influencing every component of product, service, or operational costs.

Target Costing is a proactive Cost Planning, Cost Management, and Cost Reduction practice.  Costs are planned and managed out of a product and business early in product life-cycle, rather than during the later stages.  The fundamental objective of Target Costing is to make the business profitable in any competitive marketplace.  Target Costing is widely used in several industries e.g. manufacturing, energy, healthcare, construction, and a host of others.

Some key features of Target Costing are:

  • Seller is a price taker rather than a price maker.
  • The target selling price incorporates desired profit margin.
  • Product design, specifications, and customer expectations are built-in while formulating the total selling price.
  • Cost reduction and effective cost management is the corner stone of management strategy.
  • Target Cost has to be achieved through team collaboration during activities such as designing, purchasing, manufacturing, marketing, and other activities.

Target Costing presents the following advantages over other product pricing techniques:

  • More value delivered to customer since the product is created keeping in mind the expectation of the customer.
  • Approach to designing and manufacturing products is market driven.
  • Competitive Advantage gained through process improvement and product innovation.
  • Drastic Process Improvement, which creates economies of scale.
  • New market opportunities converted into real savings to achieve the best value for money rather than to simply realize the lowest cost.

The Target Costing process comprises 3 main phases.

  1. Market-Driven Target Costing
  2. Product-Level Target Costing
  3. Component-Level Target Costing


Let’s discuss the 3 phases briefly.

1. Market-Driven Target Costing

In this phase, Selling Price is determined by analyzing the entire industry value chain and all functions of the firm.  The focus of this costing phase is on analyzing market conditions and determining the company’s Profit Margin in order to identify the “Allowable Cost” of a product.

In this phase, the desired profit level is set on the basis of firm’s strategy and financial goals, and is deducted from Selling Price to obtain Allowable costs.  Intensity of competition, nature of customers, similar product introduction by competitors, and level of customer sophistication are the key factors influencing Market-driven Target Costing.

2. Product-Level Target Costing

In this phase, Allowable Cost only gives a ball-park figure of cost saving to be achieved.  It has to be translated into Achievable Target Cost.  This type of costing concentrates on designing products that satisfy the company’s customers at the Allowable Cost.  The cardinal rule of Product-level Target Costing is to never exceed the Target Cost.

The objective of this Target Costing phase is to create intense but realistic pressure on the product designers to reduce costs.  Product Strategy (number of products in the line, frequency of redesign, degree of innovation) and product characteristics (complexity, magnitude of up-front investments, and duration of product development) are the key factors affecting Product-level Target Costing.

3. Component- Level Target Costing

The Component-level Target Costing settles the price at which a firm is willing to purchase the externally-acquired components being used in its product.  This phase involves a cross-functional team that is tasked to reduce costs across all functions such as designing, purchasing, manufacturing, marketing, and other activities.

The components cost history serves as the starting point for estimating the new component-level target costs alongside optimal selection of suppliers.  A supplier-focused strategy is the key factor that influences Component-level Target Costing.

Interested in learning more about how the Target Costing process works and its key steps? You can download an editable PowerPoint on Target Costing here on the Flevy documents marketplace.

Are you a Management Consultant?

You can download this and hundreds of other consulting frameworks and consulting training guides from the FlevyPro library.

A commonly quoted statistic is that 80% to 95% of the cost of a product is determined by its design and is therefore set before the item enters manufacturing. This pic 1 5 Cost Management Strategiesassumption suggests that the dominant focus of Cost Management should be during Product Development and not during Manufacturing.

However, contrary to a widely held assumption, companies can integrate a variety of Cost Management techniques not only in the design phase but throughout the product life cycle.  This is to ensure that there is a substantial reduction in costs.  In fact, companies achieving Operational Excellence and competing aggressively on cost might consider the adoption of some form of an Integrated Cost Management Program that spans the entire product life cycle.

An organization must have a good understanding of Integrated Cost Management and the 5 Cost Management Strategies that they can use to reduce costs but still attain the desired level of functionality and quality at the target costs.

The 5 Cost Management Strategies

 The 5 Cost Management Strategies play a crucial role in the company’s integrated approach to Cost Management.

The 5 Cost Management Strategies can be applied throughout the product life cycle with one technique used during the product design and the rest during manufacturing.

  1. Target Costing. This is a technique applied during the design stage. Target Costing is best used when the manufacturing phase of the life cycle of a product is short.
  1. Product-specific Kaizen Costing. This is a technique applied during the early stages of the manufacturing phase. It enables the rapid redesign of a new product to correct for any cost overruns. The primary rule in Product-specific Kaizen Costing is that the product’s functionality and quality have to remain constant.
  1. General Kaizen Costing. The third Cost Management Strategy, this technique is applied during the manufacturing phase. It focuses on the way a product is manufactured with the assumption that the product’s design is already set.  This technique is effective when addressing manufacturing processes that are used across several product generations.
  1. Functional Group Management. This is the technique that is applied in the production process. Functional Group Management consists of breaking the production process into autonomous groups and treating each group as a profit instead of a cost center. The switch to profit as opposed to cost allows groups to increase the throughput of production processes even if changes result in higher costs. It enables the change in mindset that functional group management induces.
  1. Product Costing. The 5th Cost Management Strategy, this is the technique that coordinates the efforts of the other four techniques. It does coordination work by providing the other four techniques with important, up-to-date information.

Target Costing vis-a-vis Kaizen Costing

Kaizen Costing as known as continuous improvement costing.  It is a method of reducing managing costs. Kaizen Costing has a similarity with Target Costing but it also has its differences.  (Note: Kaizen is the Japanese term for Continuous Improvement and often tied to the philosophy of Lean Management.)

Both Kaizen Costing and Target Costing can achieve results with lower resources. This is basically their similarity. On the other hand, the differences lie in their usage and involvement.

Target Costing is used on the design stage and requires the involvement only of designers. On the other hand, Kaizen Costing is used during the manufacturing stage and requires high involvement of employees.  The general idea of Kaizen Costing is to determine target costs, design products, and process to not exceed those costs.

Interested in gaining more understanding of these Cost Management Strategies? You can learn more and download an editable PowerPoint about 5 Cost Management Strategies here on the Flevy documents marketplace.

Are you a management consultant?

You can download this and hundreds of other consulting frameworks and consulting training guides from the FlevyPro library.

Through this Sunday, learnPPT is having a promo for the Cost Reduction Toolkit.  This detailed document identifies over 45+ cost cutting initiatives across the Value Chain.  For each initiative, examples are provided, along with projected potential savings.

The Cost Management opportunities are broken down into the areas of:

  • Enterprise-wide - These opportunities are cross-functional, meaning they can affect multiple functions within an organization.  The impact is largely to SG&A costs.
  • Asset Management - These opportunities target the improvement of fixed assets efficiency and decreasing net working capital.  The impact is largely capital efficiency.
  • Function-specific - Opportunities in this category are specific to primary and support functional activities.  These are operational and transactional in nature.

This toolkit also explains the levers and challenges to profitability, as well as the formula identifying cost reduction opportunities.

Here’s a partial preview of the PowerPoint presentation.

Questions, thoughts, concerns?  Go to my site (learnppt.com) and shoot me an email.

For pre-made PowerPoint diagrams used in business presentations and other powerpointing needs, browse our library here: learnppt.com/powerpoint/.  These diagrams were professionally designed by management consultants. Give your presentations the look and feel of a final product made by McKinsey, BCG, Bain, Booz Allen, Deloitte, or any of the top consulting firms.