Currently viewing the tag: "Product Pricing"

CostingCost-based Pricing is fast becoming a relic of the past and being substituted by the concept of Target Costing.  Target Costing is referred to as an organized process to determine the cost at which a proposed product must be developed so as to generate profits at the product’s anticipated selling price in future.

In highly competitive markets such as FMCG, construction, healthcare, and energy, prices are determined by market forces.  Producers cannot effectively control selling prices.  The only control, to some extent, is over costs, so management’s focus has to be on influencing every component of product, service, or operational costs.

Target Costing is a proactive Cost Planning, Cost Management, and Cost Reduction practice.  Costs are planned and managed out of a product and business early in product life-cycle, rather than during the later stages.  The fundamental objective of Target Costing is to make the business profitable in any competitive marketplace.  Target Costing is widely used in several industries e.g. manufacturing, energy, healthcare, construction, and a host of others.

Some key features of Target Costing are:

  • Seller is a price taker rather than a price maker.
  • The target selling price incorporates desired profit margin.
  • Product design, specifications, and customer expectations are built-in while formulating the total selling price.
  • Cost reduction and effective cost management is the corner stone of management strategy.
  • Target Cost has to be achieved through team collaboration during activities such as designing, purchasing, manufacturing, marketing, and other activities.

Target Costing presents the following advantages over other product pricing techniques:

  • More value delivered to customer since the product is created keeping in mind the expectation of the customer.
  • Approach to designing and manufacturing products is market driven.
  • Competitive Advantage gained through process improvement and product innovation.
  • Drastic Process Improvement, which creates economies of scale.
  • New market opportunities converted into real savings to achieve the best value for money rather than to simply realize the lowest cost.

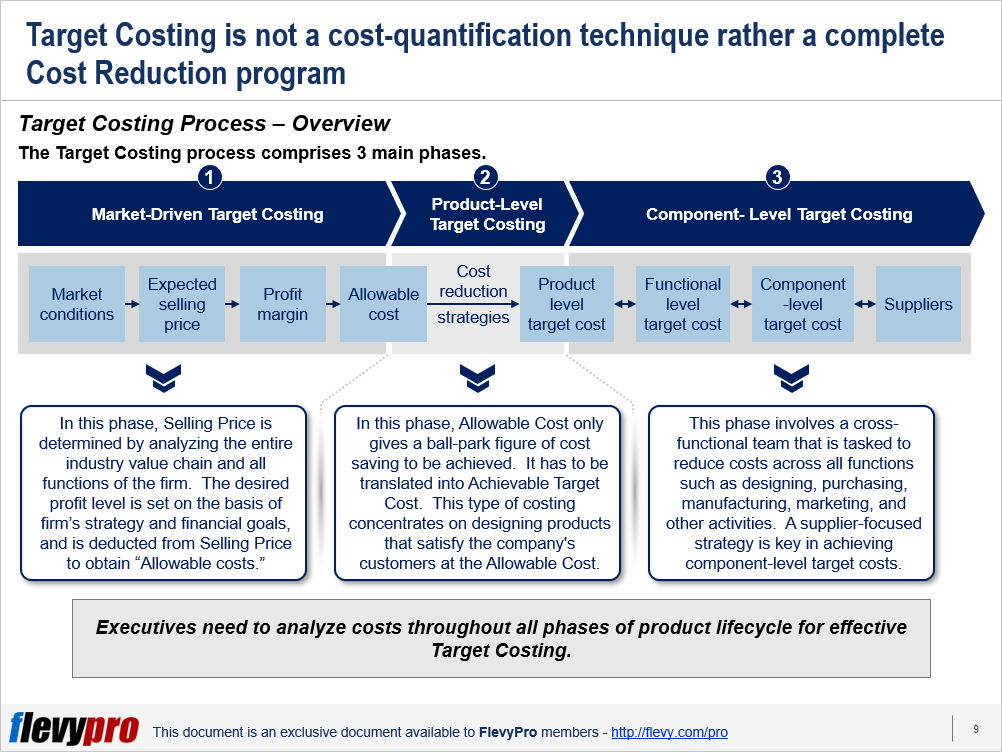
The Target Costing process comprises 3 main phases.

  1. Market-Driven Target Costing
  2. Product-Level Target Costing
  3. Component-Level Target Costing


Let’s discuss the 3 phases briefly.

1. Market-Driven Target Costing

In this phase, Selling Price is determined by analyzing the entire industry value chain and all functions of the firm.  The focus of this costing phase is on analyzing market conditions and determining the company’s Profit Margin in order to identify the “Allowable Cost” of a product.

In this phase, the desired profit level is set on the basis of firm’s strategy and financial goals, and is deducted from Selling Price to obtain Allowable costs.  Intensity of competition, nature of customers, similar product introduction by competitors, and level of customer sophistication are the key factors influencing Market-driven Target Costing.

2. Product-Level Target Costing

In this phase, Allowable Cost only gives a ball-park figure of cost saving to be achieved.  It has to be translated into Achievable Target Cost.  This type of costing concentrates on designing products that satisfy the company’s customers at the Allowable Cost.  The cardinal rule of Product-level Target Costing is to never exceed the Target Cost.

The objective of this Target Costing phase is to create intense but realistic pressure on the product designers to reduce costs.  Product Strategy (number of products in the line, frequency of redesign, degree of innovation) and product characteristics (complexity, magnitude of up-front investments, and duration of product development) are the key factors affecting Product-level Target Costing.

3. Component- Level Target Costing

The Component-level Target Costing settles the price at which a firm is willing to purchase the externally-acquired components being used in its product.  This phase involves a cross-functional team that is tasked to reduce costs across all functions such as designing, purchasing, manufacturing, marketing, and other activities.

The components cost history serves as the starting point for estimating the new component-level target costs alongside optimal selection of suppliers.  A supplier-focused strategy is the key factor that influences Component-level Target Costing.

Interested in learning more about how the Target Costing process works and its key steps? You can download an editable PowerPoint on Target Costing here on the Flevy documents marketplace.

Are you a Management Consultant?

You can download this and hundreds of other consulting frameworks and consulting training guides from the FlevyPro library.

microscope-analysis
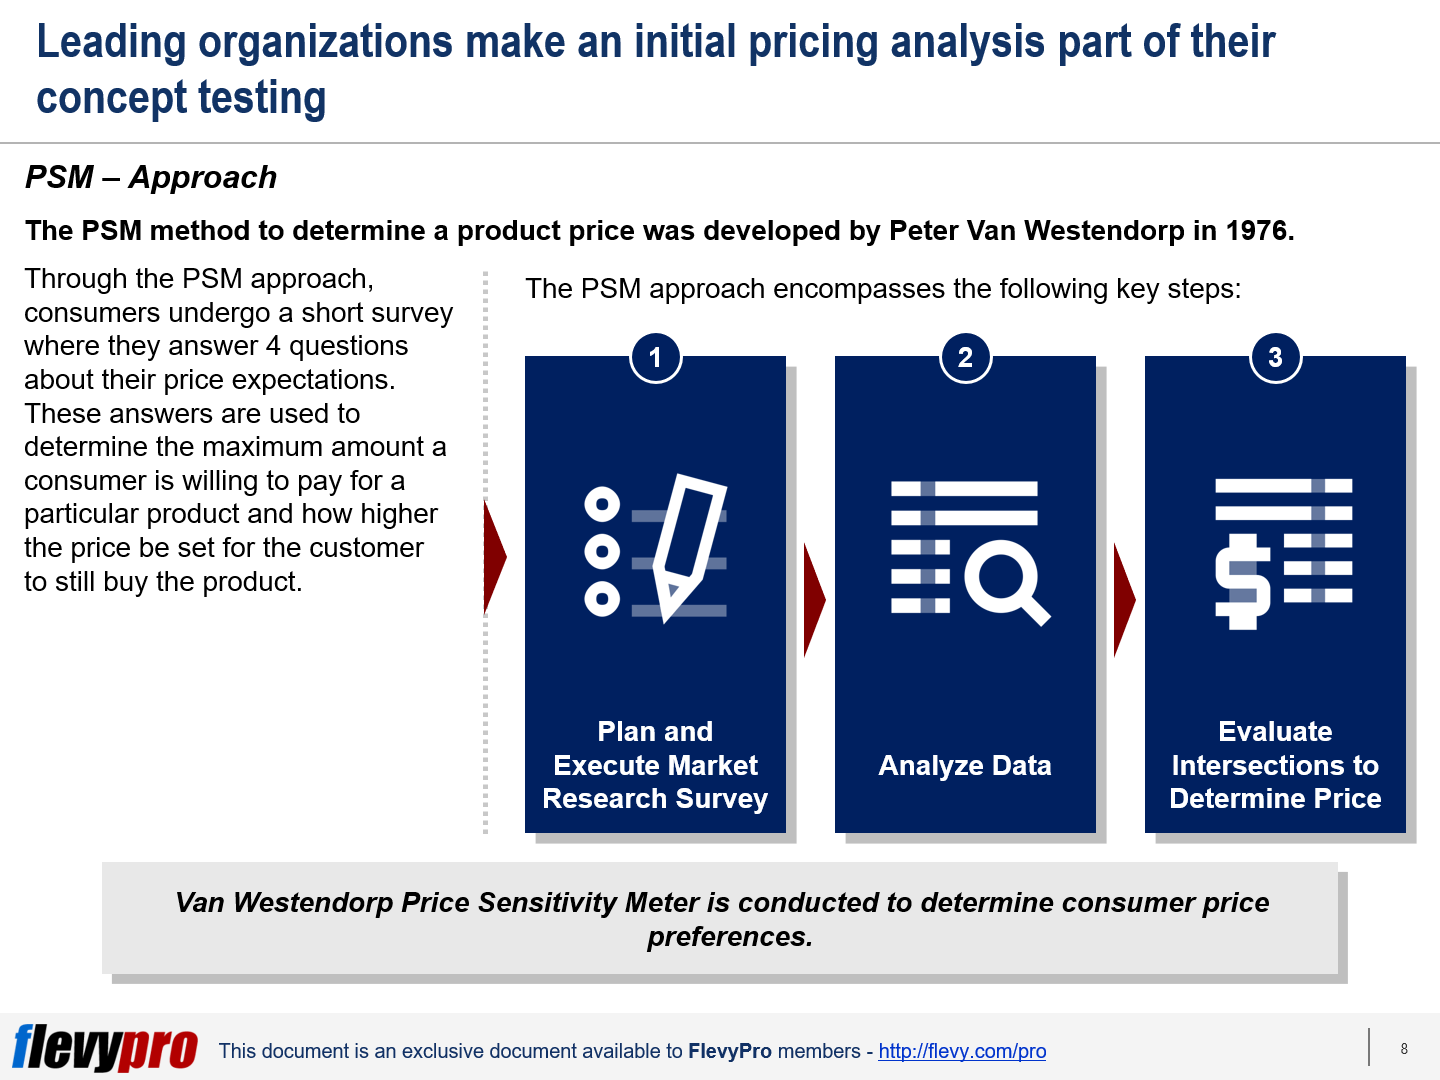
Identifying what the market wants is a critical issue for most executives.  Likewise, the decision on how much to charge for a product is also crucial for planners.  This is where Market Research comes to rescue.

One of the Marketing Research methods that researchers most commonly employ is the Conjoint (Trade-off) Analysis.  Conjoint Analysis helps in identifying product features that consumers prefer, discerning the impact of price changes on demand, and estimating the probability of product acceptance in the market.

In contrast to directly inquiring from the respondents about the most important feature in a product, Conjoint Analysis makes the survey participants assess product profiles.  These product profiles comprise various linked—or conjoined—product features, therefore the analysis is termed “Conjoint Analysis.”  Conjoint Analysis simulates real-world buying situations where the researchers statistically determine the product attributes—that carry the most impact and are attractive to the participants—by substituting the features and recording the participants’ responses.

The Conjoint Analysis Approach

The Conjoint Analysis is useful in creating market models to estimate market share, revenue, or profitability.  The Conjoint Analysis is widely used in marketing, product management, and operations research.  The Conjoint Analysis approach entails the following key steps:

  1. Determine the Study Type
  2. Identify Relevant Features
  3. Establish Values for Each Feature
  4. Design Questionnaire
  5. Collect Data
  6. Analyze Data

1. Determine the Study Type

The first step of the Conjoint Analysis involves ascertaining and selecting from a number of different types of Conjoint Analysis methods available.  This should be determined based on the individual requirements of the organization.

2. Identify Relevant Features

The next step of the Conjoint Analysis entails categorizing the key features or relevant attributes of a product.  For instance, setting the main product attributes in terms of size, appearance, price.

3. Establish Values for Each Feature

After selecting the key features of the product, the next step in Conjoint Analysis is to choose some values for each of the itemized features that have to be enumerated.  A combination of features in different forms should be chosen to present to the participants.  The presentation could be written notes describing the products or in the form of pictorial descriptions.

4. Design Questionnaire

The basic forms of Conjoint Analysis—practiced in the past—encompassed a set of product features (4 to 5) used to create profiles, displayed to the respondents on individual cards for ranking.  These days, different design techniques and automated tools are used to reduce the number of profiles while maintaining enough data availability for analysis.  The questionnaire length depends on the number of features to be evaluated and the Conjoint Analysis type employed.

5. Collect Data

A statistically viable sample size and accuracy should be considered while planning a Conjoint Analysis survey.  It is up to the senior management to decide how they want to gather the responses—by taking the responses from each individual and analyzing them individually, collecting all the responses into a single utility function, or dividing the respondents into segments and recording their preferences.

6. Analyze Data

Various econometric and statistical methods are utilized to analyze the data gathered through the Conjoint exercise.  This includes linear programming techniques for earlier Conjoint types, linear regression to rate Full-Profile Tasks, and Maximum Likelihood Estimation (MLE) for Choice-based Conjoint.

Types of Conjoint Analysis

There are a number of Conjoint Analysis types available for the marketing researchers to choose from, including:

  1. Two-Attribute Tradeoff Analysis
  2. Full-Profile Conjoint Analysis
  3. Adaptive Conjoint Analysis
  4. Choice-Based Conjoint Analysis
  5. Self-Explicated Conjoint Analysis
  6. Max-Diff Conjoint Analysis
  7. Hierarchical Bayes Analysis (HB)

Interested in learning more about Conjoint Analysis?  You can download an editable PowerPoint on Conjoint Analysis Primer here on the Flevy documents marketplace.

Are you a Management Consultant?

You can download this and hundreds of other consulting frameworks and consulting training guides from the FlevyPro library.

assorted-variety-of-fruits-2255903The decision for pricing a product or service isn’t as simple as it seems.  It is a key consideration for executives.  Pricing way above the rival products risks not attracting the required customers while charging way below the competitor products could be equally detrimental.

Manufacturers can utilize research to have a better understanding on what consumers are willing to pay for a product.  There are a host of research-based pricing approaches available—e.g., Monadic, Sequential Monadic, Conjoint Analysis, Van Westendorp Price Sensitivity Meter etc.—however, researchers often get confused on which one to use in a given product development phase.  Let’s discuss the Van Westendorp Price Sensitivity Meter approach for now.

The Price Sensitivity Meter (PSM) is an easy-to-use method of evaluating price of a new product.  The method was developed by Peter Van Westendorp in 1976.  Through the PSM approach, consumers undergo a short survey where they answer 4 questions about their price expectations.  These answers are used to determine the maximum amount a consumer is willing to pay for a particular product and how higher the price be set for the customer to still buy the product.

The approach offers a ball-park figure for the price of a product, is easy to administer, requires less effort from the consumers, and the PSM results are communicated in the form of simple diagrams.  The approach, however, surveys only the “willingness to pay” attribute of a product, and is more appropriate for innovative products—as it is not easy to determine prices with competing products using this approach.  PSM analysis should be a part of your Pricing Strategy process.

The PSM approach encompasses the following key phases:

  1. Plan and Execute Market Research Survey
  2. Analyze Data
  3. Evaluate Intersections to Determine Price

Let’s discuss the first 2 phases of the approach.

Plan and Execute Market Research Survey

The initial phase of the PSM research entails deciding on the medium of the study and planning the logistics, design, resources, guidelines, and governance protocols for the survey.  More specifically, the phase involves:

  • Preparing the field research plans.
  • Determining whether the survey should be conducted online, telephonically, or face-to-face.
  • Identifying the consumers (respondents).
  • Assigning the required resources to the survey.
  • Getting the data collection tools and research instrument (questionnaire) ready.
  • The questionnaire includes the following questions:
    • At what price the product would become so expensive for you to even consider buying it?
    • Indicate the price that is expensive for you but you would still buy the product?
    • What would be the price that is too cheap for the product where you would start doubting its quality and not buy it?
    • Indicate the price of the product where you would consider it a great value for money (a bargain)?
  • Gathering data from the survey participants.

Analyze Data

The second phase pertains to analyzing the respondents’ data from the field survey.  This is done once the field data has been validated and cleansed of any inconsistent errors.  The steps taken in this phase include:

  • Ordering the 4 questions in a manner that it ranks prices as “Too Cheap,” “Bargain,” “Getting Expensive,” and “Too Expensive.”  The values of these ranks should be kept in numeric dollar values.
  • Plotting the responses of the survey participants on a graph.
  • Depicting the prices on the X-axis.
  • Representing the percentage of consumers who quoted the respective price (i.e. the cumulative frequency) on the Y-axis.
  • Reversing the values of the two curves.
    • The curves with the values “Too Cheap” and “Too Expensive” are drawn with inverse values. This creates two other curves.  These curves show the percentage of consumers who regard prices as “Getting Expensive” and “Bargain”.

Interested in learning more about the other phase of the Van Westendorp Price Sensitivity Meter?  You can download an editable PowerPoint on the Price Sensitivity Meter (PSM) here on the Flevy documents marketplace.

Are you a Management Consultant?

You can download this and hundreds of other consulting frameworks and consulting training guides from the FlevyPro library.