 Become a PowerPoint Guru by Dave Tracy
Learn the methodologies, frameworks, and tricks used by Management Consultants to create executive presentations in the business world.
Become a PowerPoint Guru by Dave Tracy
The concept of Return on Investment (ROI) was formed as part of the concept of Value Creation. The origins of ROI were in the Manufacturing sector, where it’s simple to measure time and output. Next, to adopt the concept was the Banking industry where intense competition necessitated Innovation Management and with that the need to calculate ROI. ROI calculation is now a common feature in every industry and business function.
Employee Training is part and parcel of workforce development. It necessitates spending a lot of effort and resources. Deliberating if the Training Program is going to be worth all the costs is a valid concern.
Return on Training Investment (ROTI) is the comparison between financial benefits obtained from a training program and the total cost of running that training program. The objective of ROTI analysis is to see whether the benefits outweigh the costs i.e., to establish if the investment was worthwhile.
ROTI calculation and analysis is significant when:
ROTI can be calculated dependably so long as:
ROTI calculation involves selecting performance measures, gathering data on those measures as well as data on costs—both direct and indirect—related to training, and lastly calculating the Return On Training Investments.
Key steps in the ROTI calculation are:
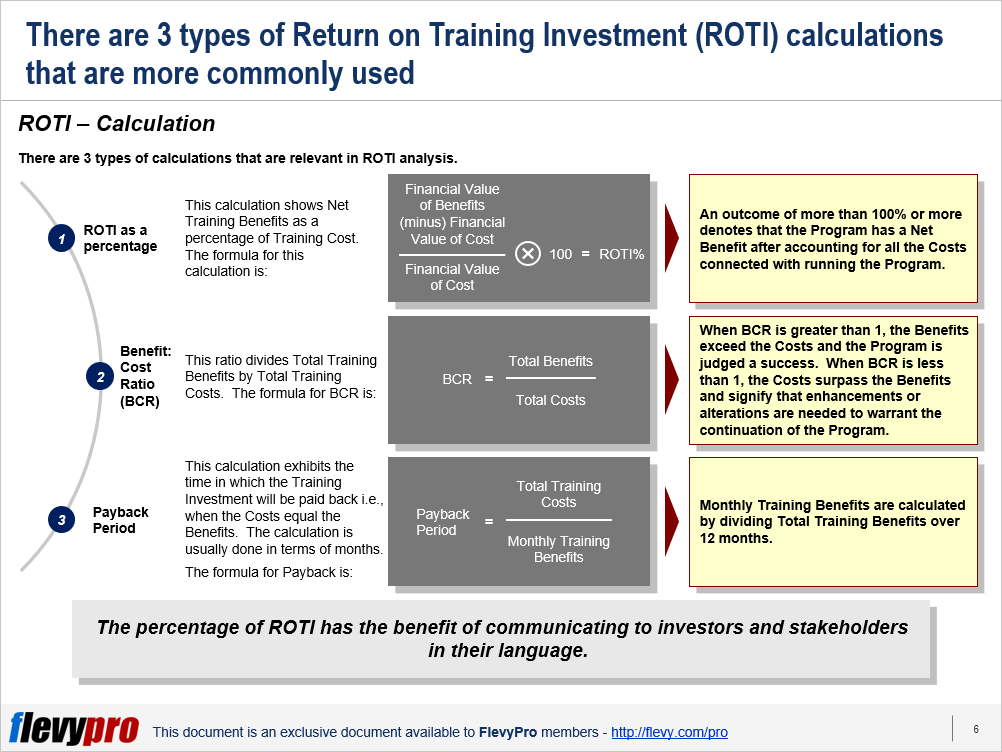
There are 3 types of calculations that are relevant in ROTI analysis.
Let us delve a little deeper into the calculation methods.
This calculation shows Net Training Benefits as a percentage of Training Cost. An outcome of 100% or more denotes that the Program has a Net Benefit after accounting for all the costs connected with running the program.
This ratio divides Total Training Benefits by Total Training Costs. When BCR is greater than 1, the benefits exceed the costs and the program is judged a success. When BCR is less than 1, the costs surpass the benefits and signify that enhancements or alterations are needed to warrant the continuation of the program.
This calculation exhibits the time in which the Training Investment will be paid back i.e., when the costs equal the benefits. The calculation is usually done in terms of months.
Monthly Training Benefits are calculated by dividing Total Training Benefits over 12 months.
It is pertinent to note that although ROTI analysis is important in evaluating a training program, merely a ROTI calculation will not typically be adequate to make the business case for a Training Program or influence top management to act. Sometimes we have to consider non-monetary benefits of training, such as a change in attitude. When monetary and non-monetary benefits are combined, these supplement Performance Management resulting in benefits such as reduced absenteeism, lower turnover rates, and more promotions from within.
Interested in learning more about Return on Training Investment? You can download an editable PowerPoint on Return On Training Investment (ROTI) here on the Flevy documents marketplace.
Gain the knowledge and develop the expertise to become an expert in Human Resource Management (HRM). Our frameworks are based on the thought leadership of leading consulting firms, academics, and recognized subject matter experts. Click here for full details.
The purpose of Human Resources (HR) is to ensure our organization achieves success through our people. Without the right people in place—at all levels of the organization—we will never be able to execute our Strategy effectively.
This begs the question: Does your organization view HR as a support function or a strategic one? Research shows leading organizations leverage HR as a strategic function, one that both supports and drives the organization’s Strategy. In fact, having strong HRM capabilities is a source of Competitive Advantage.
This has never been more true than right now in the Digital Age, as organizations must compete for specialized talent to drive forward their Digital Transformation Strategies. Beyond just hiring and selection, HR also plays the critical role in retaining talent—by keeping people engaged, motivated, and happy.
Learn about our Human Resource Management (HRM) Best Practice Frameworks here.
You can download in-depth presentations on this and hundreds of similar business frameworks from the FlevyPro Library. FlevyPro is trusted and utilized by 1000s of management consultants and corporate executives. Here’s what some have to say:
“My FlevyPro subscription provides me with the most popular frameworks and decks in demand in today’s market. They not only augment my existing consulting and coaching offerings and delivery, but also keep me abreast of the latest trends, inspire new products and service offerings for my practice, and educate me in a fraction of the time and money of other solutions. I strongly recommend FlevyPro to any consultant serious about success.”
– Bill Branson, Founder at Strategic Business Architects
“As a niche strategic consulting firm, Flevy and FlevyPro frameworks and documents are an on-going reference to help us structure our findings and recommendations to our clients as well as improve their clarity, strength, and visual power. For us, it is an invaluable resource to increase our impact and value.”
– David Coloma, Consulting Area Manager at Cynertia Consulting
“FlevyPro has been a brilliant resource for me, as an independent growth consultant, to access a vast knowledge bank of presentations to support my work with clients. In terms of RoI, the value I received from the very first presentation I downloaded paid for my subscription many times over! The quality of the decks available allows me to punch way above my weight – it’s like having the resources of a Big 4 consultancy at your fingertips at a microscopic fraction of the overhead.”
– Roderick Cameron, Founding Partner at SGFE Ltd
 The typical approach to improving productivity focuses on assessing variance in quality, time, rate, service, or cost, around which management systems develop incrementally or revolutionary.
Organizational Health Index, on the contrary, focuses on improving performance through improved alignment of organizational systems. For example, by improving competence of key components such as mindset, work design, technical expertise, or relationships; or through improving the interface between work processes, or the interaction between work practices.
Simply put, the capability of an organization to achieve its strategic goals and their alignment defines an organization’s health. The Organizational Health Index (OHI) leverages logical consistency to manage the organizational health. OHI entails quantifiable evaluations, diagnostics and recipes for success that allow the leaders to calculate and accomplish the organizational health goals, required to sustain long-term performance.
Organizational health refers to the need to address soft (leadership, direction or culture) and hard factors (accountability, reporting lines, or controls) affecting performance. The organizational health index is an ongoing continuous improvement system applicable across an organization. The OHI measures not only the current health level, but also determines the next steps for an organization. There are numerous advantages to the organizations implementing it, including:
The OHI Diagnostic Framework provides a road map for leaders and managers to improve organizational health. It measures the organization against the 9 most critical health outcomes; these outcomes comprise both hard and soft organizational elements. Careful measurement of these 9 elements has a proven link with improved financial performance and earning above-average EBITDA margins:
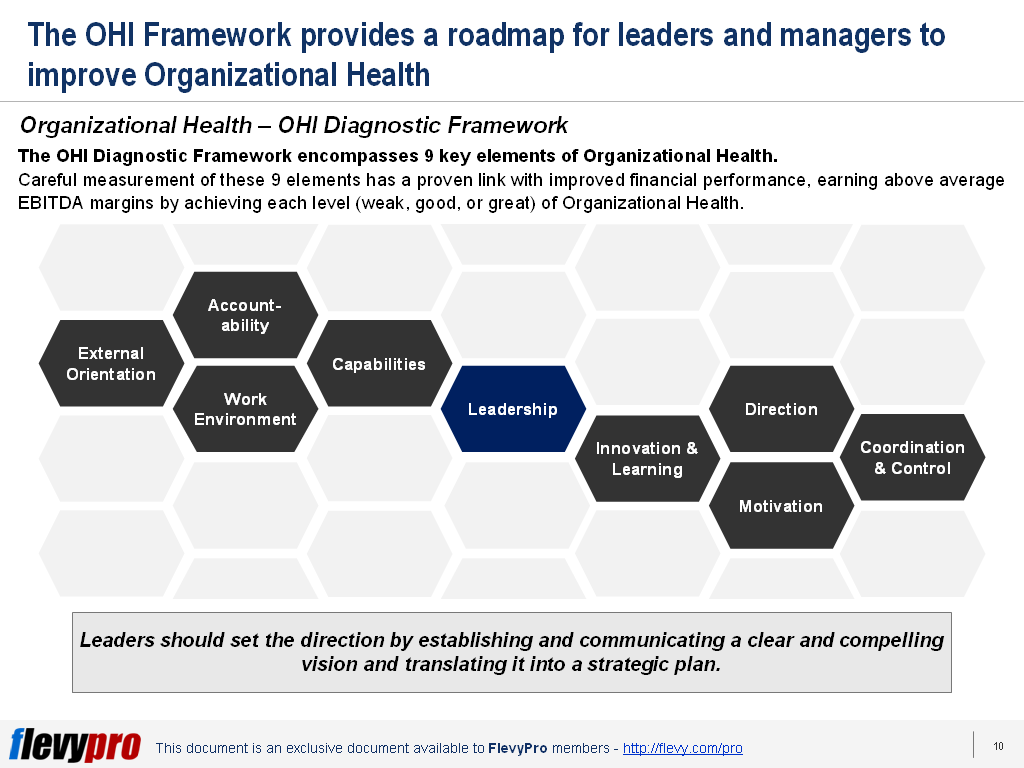
Direction
Accountability
Coordination and Control
External Orientation
Leadership
Innovation and Learning
Capabilities
Motivation
Work Environment
Years of research have shown the healthiest companies to align with 1 of the 4 recipes for organizational health. These recipes constitute concrete management practices and activities for the organization to implement. Leaders need to acknowledge and align to the recipe that is appropriate for them. They can use these success recipes to plan and implement a change program that results in sustainable outcomes. The 4 recipes for organizational health are:
Interested in learning more about the other recipes for Organizational Health and the OHI Diagnostic Framework? You can download an editable PowerPoint on Organizational Health Index here on the Flevy documents marketplace.
You can download this and hundreds of other consulting frameworks and consulting training guides from the FlevyPro library.
Here is a list of 4 PowerPoint documents that convey over 100+ different business frameworks and management models. They cover just about every business concept you can imagine. At the bottom, I’ve listed all the frameworks included in each document.
23 Corporate Strategy and Management Models
https://flevy.com/browse/business-document/corporate-strategy-and-management-models-129
30 Business Performance Improvement Models
https://flevy.com/browse/business-document/business-performance-improvement-models-218
28 Organization, Change, and HR Models
https://flevy.com/browse/business-document/organization-change-and-hr-models-616
28 IT Management Models
https://flevy.com/browse/business-document/it-management-models-224
Flevy’s full collection of PowerPoint templates can be found here: https://flevy.com/function/powerpoint-templates-ppt
* * * *
CONTENTS OF CORPORATE STRATEGY AND MANAGEMENT MODELS
1. 3 C’s
2. ADL Matrix
3. Acquisitions Integration Approaches
4. Blue Ocean Strategy
5. Capability Maturity Model
6. GE-McKinsey Matrix
7. OODA Loop
8. Profit Pools
9. Resource-based View of Firm
10. Scenario Planning
11. Strategy Maps
12. Application Portfolio Optimization
13. Value Stream Mapping
14. Six Thinking Hats
15. 4 P’s Marketing Mix
16. 7 P’s Marketing Mix
17. 6 Change Approaches
18. Cultural Dimensions Theory
19. Six Sigma Quality Management
20. Change Management Iceberg
21. Organizational Learning
22. Performance Prism
23. Crossing the Chasm
CONTENTS OF BUSINESS IMPROVEMENT MODELS
1. ISO 9001 Quality Management Model
2. Baldrige Performance Excellence Model
3. EFQM Business Excellence Model
4. Balanced Scorecard
5. Hoshin Kanri Model
6. Benchmarking Model
7. Business Process Re-engineering Model
8. Shingo Model for Lean Transformation
9. Lean Management Model (TPS)
10. Lean Leadership & Kaizen Model
11. Lean Maturity Model
12. Value Stream Mapping
13. Eight Types of Waste
14. Lean Levers
15. Gemba Framework
16. Cause & Effect Diagram ( Fishbone Diagram, Ishikawa Diagram)
17. 5S Principles
18. Plan-Do-Check-Act Model
19. PDCA Problem Solving Process
20. Total Productive Maintenance (TPM) Pillars
21. DMAIC Process Improvement Model
22. Law of 10
23. Training Within Industry (TWI)
24. A3 Storyboard Template
25. PACE Prioritization Matrix
26. Payoff Evaluation Matrix
27. Cost of Quality Model
28. SERVQUAL Model
29. ADKAR Model
30. Kotter Change Management Model
CONTENTS OF ORGANIZATION, CHANGE, HR MODELS
1. IMPA HR Competency Model
2. NAPA Competency Model for HR Professionals
3. Ulrich’s HR Competency Model
4. Ulrich’s Matrix on the Four Roles of HR
5. The Harvard Model of Strategic HRM
6. AHRI Model of Excellence
7. People Capability Maturity Model (PCMM)
8. SHRM Elements for HR Success
9. Ulrich’s Stages of Employee Connection to the Organization
10. Talent Management Framework
11. Novations Four Stages of Contribution Model
12. Ulrich’s Five Rules for Leadership (Leadership Code)
13. ASTD Competency Model
14. Senge’s Learning Organization Model
15. High-Impact Learning Organization Model
16. Tuckman’s Model of Team Development Stages
17. The Emotional Competence Framework
18. Bridges’ Transition Model
19. Lewin’s Three Stage Change Model
20. The McKinsey 7S Model
21. ADKAR Change Model
22. Kotter’s Change Management Model
23. Cause & Effect Diagram for HR Systems
24. ISO 9001 Quality Management Model
25. Baldrige Performance Excellence Model
26. EFQM Business Excellence Model
27. Kaplan & Norton Balance Scorecard
28. Xerox Benchmarking Model
CONTENTS OF IT FRAMEWORKS
1. IT Infrastructure Library (ITIL) Model
2. ISO/IEC 20000 IT Service Management Model
3. ISO/IEC 27000 Information Security Management Systems Model
4. COBIT 5 Model
5. Capability Maturity Model Integration (CMMI)
6. People Capability Maturity Model (PCMM)
7. ISO/IEC 15504 (SPICE)
8. Organizational Project Management Maturity Model (OPM3)
9. Portfolio, Programme, Project Management Maturity Model (P3M3)
10. Portfolio, Programme, Project Office Model (P3O)
11. PRINCE2 Project Management Model
12. IDEAL Model
13. Waterfall Model
14. Agile Model
15. Scrum Model
16. Enterprise Data Architecture Models
17. COPC-2000 Model
18. Lean Levers for IT Outsourcing
19. Cause & Effect Diagram ( Fishbone Diagram, Ishikawa Diagram)
20. DMAIC Process Improvement Model (Six Sigma)
21. ISO 9001 Quality Management Model
22. Malcolm Baldrige Performance Excellence Model
23. EFQM Business Excellence Model
24. Balanced Scorecard
25. Xerox Benchmarking Model
26. SERVQUAL Model
27. ADKAR Model
28. Kotter Change Management Model
OE Consulting has just uploaded a new document on Flevy that’s a collection of PowerPoint templates illustrating 25 different Business Performance Improvement models and frameworks. Check it out here:
The 25 business models are: